


A friend of mine, a CHRO at a large automotive manufacturer, told me something last year that stuck with me. Her HR team spent six months building a performance management process they were proud of—clear templates, structured reviews, everything in place. But within three months on the shop floor, no one was using it.
When I shared this with other HR leaders in manufacturing, they all said the same thing. Night-shift operators going a year without real feedback. Supervisors rushing through reviews just to meet deadlines. The very people driving production were the most disconnected from the system.
This pattern shows up everywhere—from plants with 500 employees to operations with 50,000. And it aligns with what Gallup found: only one in five workers feels their performance is managed in a way that actually motivates them.
In manufacturing, that’s not just a culture issue. It’s a strategy problem.
This guide pulls together what the sharpest HR and operations leaders in my network have learned building performance management for manufacturing from the ground up. Take what works for your floor and leave the rest.
Why the Standard HR Playbook Breaks Down on the Shop Floor
Most performance management frameworks were designed for knowledge workers sitting at desks with reliable internet access and an email inbox they check regularly. I am not criticizing those frameworks. They work well in that context.
But manufacturing is a completely different environment. Your frontline operators are running machines, managing materials, and staying focused on safety. They are not checking a performance portal between production cycles. They are not reflecting on competency frameworks during a night shift handoff. And asking them to is setting your performance system up to fail before it starts.
Three things make manufacturing genuinely different from every other sector where you might run a standard performance process.
1. Shift fragmentation is real and it is damaging.
A 2,000-person plant running three shifts means that your performance expectations, feedback quality, and review completion rates vary dramatically depending on which shift a worker is assigned to. Day-shift crews get structure. Night-shift operators get a conversation when something goes wrong. That inconsistency erodes trust faster than almost anything else.
2. Your workforce is deskless by design.
An email survey sent to a machine operator at 2am is not a listening strategy. It is a compliance exercise. When you design performance management processes assuming digital access that does not exist on your factory floor, you get the 28 to 40% survey response rates that most manufacturing HR teams accept as normal. They are not normal. They are a design failure.
3. The stakes are fundamentally higher.
In most offices, a performance gap produces a missed deadline. In manufacturing, it produces a defective batch, a safety incident, or a line shutdown. Performance management in this environment has to reflect what is actually at risk, not borrow language and structure from a white-collar performance review template.
The Two KPI Tracks You Need to Run in Parallel
Here is the gap I heard in most enterprise manufacturing HR functions. They track operational KPIs religiously. OEE on dashboards everywhere. Throughput reviewed in every ops meeting. Scrap rate on the board in every department.
And then they track people KPIs separately, quarterly if at all, averaged at the plant level, and almost never connected to the operational picture. The data lives in HR and the ops team never sees it.
The manufacturing organizations my network keeps pointing back to as examples of what good looks like are the ones that run both tracks simultaneously and share the data across functions. Operational KPIs tell you what is happening on the floor right now. People KPIs tell you what is going to happen in six weeks. That predictive gap is where most of the value sits.
Operational KPIs: The Numbers Your Ops Team Already Knows
I will not spend too much time here because your operations leaders already live inside these numbers. What I want HR leaders to understand is the formula behind each one, because when you speak this language with plant managers, they start treating your people data as credible rather than soft.
1. Overall Equipment Effectiveness (OEE) is calculated as Availability multiplied by Performance multiplied by Quality. World-class OEE sits at 85% or above. Most manufacturing plants average around 60%. That 25-point gap is not usually a machine problem. Every operations leader in my network who has dug into it says the same thing: it is almost always a frontline workforce performance issue.
2. Throughput measures units produced divided by total production time. It reveals bottlenecks when you compare it across shifts and production lines.
3. Cycle Time is net production time divided by number of units produced. Managers use this to set realistic output expectations by shift and catch process inefficiencies before they compound.
4. Scrap Rate is scrap units divided by total units produced, expressed as a percentage. For lean manufacturing environments, scrap rate is a direct line to material costs and downstream delivery commitments.
5. On-Time Delivery is on-time deliveries divided by total deliveries. A VP of Operations I know well told me she always looks at the performance management picture first when this number drops, not the logistics picture. Accountability breakdowns in shift handoffs show up in delivery data before anywhere else.
Lean KPIs Your Shop Floor Crews Should Own
Lean manufacturing adds a layer of metrics specifically focused on waste elimination. These are the numbers your line supervisors and machine operators need to see and take ownership of daily. They are also the numbers that connect individual operator performance directly to your plant-level goals.
1. Takt Time: Available production time divided by customer demand rate. This is the pace your shop floor crews must maintain to meet customer commitments. Every operator should know their Takt Time.
2. First Pass Yield (FPY): The percentage of units completed without any rework. High FPY tells you the process is clean and the operators running it are performing consistently. Low FPY tells you something is wrong before it shows up in your delivery data.
3. Changeover Time: How long it takes to switch a production line from one product to another. SMED methodology targets this directly. It is one of the most operator-influenced KPIs in a lean environment.
4. Value-Added Ratio: Time spent on value-adding activities as a percentage of total production time. This is where lean and performance management connect most visibly.
Five Strategies That Actually Work in Manufacturing Performance Management
1. Replace Annual Reviews With a Cadence That Fits Shift Work
Most senior HR leaders in manufacturing I talk to stopped recommending annual reviews for blue-collar workforces a long time ago. Not because feedback does not matter, but because the annual format was never designed for people working rotating shifts with no desk access and no time for a 30-minute self-reflection exercise at 11pm.
The cadence that works is built around the natural rhythms of manufacturing. It is not more work for supervisors. It is actually less, because the annual review pressure disappears when you have been giving consistent feedback throughout the year.
- Daily: A five-minute shift huddle covering safety priorities, output targets for the shift, and one recognition moment for a specific crew member. This takes less time than most supervisors spend looking for the right form to fill out.
- Weekly: A fifteen-minute check-in with each operator. Progress on their goals, any blockers, one note about their development. Done on the floor with a mobile device, not in an office.
- Quarterly: A forty-five minute structured review. Goal assessment, skills progress, and a conversation about the next quarter. This is when the formal documentation happens.
- Annual: A comprehensive conversation that includes compensation and career direction. Still valuable, but it carries no surprises because the quarterly cadence has been running all year.
2. Cascade Goals All the Way Down to the Individual Operator
One of the most consistent failures I see in manufacturing performance management is what I call the goal cascade gap. Leadership has clear plant-level targets. Middle management has departmental targets. And the operator running Line 4 on the night shift has no idea how their daily work connects to any of it.
This is not a motivation problem. It is a communication design problem. And it is completely solvable.
- Plant Goal: OEE at or above 82%
- Line Goal: Changeover time under 12 minutes per production run
- Crew Goal: All machine operators on Line 4 complete SMED certification by end of Q2
- Individual Goal for an operator: Complete SMED certification and achieve personal changeover time below 14 minutes by April 30
When the operator on Line 4 can see that their SMED certification connects directly to the plant OEE target, the performance conversation changes completely. They are not being evaluated on abstract competencies. They are being asked to contribute to a number that everyone can see on the board.
3. Invest in Your Shift Supervisors Before Anything Else
Ask any experienced HR leader in manufacturing what single lever they would pull if they could only pick one, and almost all of them will say the same thing: supervisor capability. Not the technology, not the templates, not the reporting dashboards. The supervisors.
Gartner research found that 75% of HR leaders believe managers are already overwhelmed. Manufacturing shift supervisors are disproportionately affected. They manage larger crews, work across shifts, carry full operational responsibility, and are simultaneously expected to run structured performance conversations they have never been trained for.
When supervisors do not have the skills or tools to have good performance conversations, everything downstream falls apart. Reviews become tick-box exercises. Feedback becomes generic. Blue-collar workers feel unseen and eventually leave.
- Train supervisors in coaching conversations, not just review administration. There is a real difference between filling out a form and having a conversation that changes how someone performs.
- Give them mobile-accessible feedback templates they can use between machine cycles, not desktop portals they have to visit an office to open.
- Build real-time engagement dashboards into their workflow so they can see which crew members are disengaging before it shows up in attendance data.
- Create recognition tools that work without email or internet access. Recognition on the shop floor has to happen in the moment, not three days later through an HR portal.
The tool exist. Most supervisors have never beem given them.
4. Use Engagement Data to Predict Problems Before They Hit Your OEE
A VP of Operations at a large food manufacturing group told a colleague of mine that this was the strategy that completely changed how she thought about her HR function. Her team came to her expecting to talk about operational metrics and started by showing her engagement data by shift. She said it was the first time a people metric had ever made her want to act immediately.
McKinsey research on manufacturing workforce performance shows that companies using frontline worker feedback data to inform management decisions see 21% higher productivity than those that rely on operational metrics alone. The reason is the lag. Operational metrics are lagging indicators. Engagement data is a leading indicator.
A shift crew with declining engagement scores in week four will show elevated operator absenteeism by week six. By week eight, scrap rates are rising and your OEE is dropping. If you wait for the OEE dashboard to tell you there is a problem, you have already lost six weeks.
The data infrastructure to catch this early is not complicated. It just has to be built for the right environment, including reliable storage for manufacturing data backup to ensure performance and engagement data is never lost.
5. Design the Process for Deskless Workers From the Start
A manufacturing HR Director in my network puts it better than I can: if your performance management process requires a desktop computer, an email account, or a reliable wifi connection, it was not designed for blue-collar workers. It was designed for office workers and retrofitted onto a factory floor.
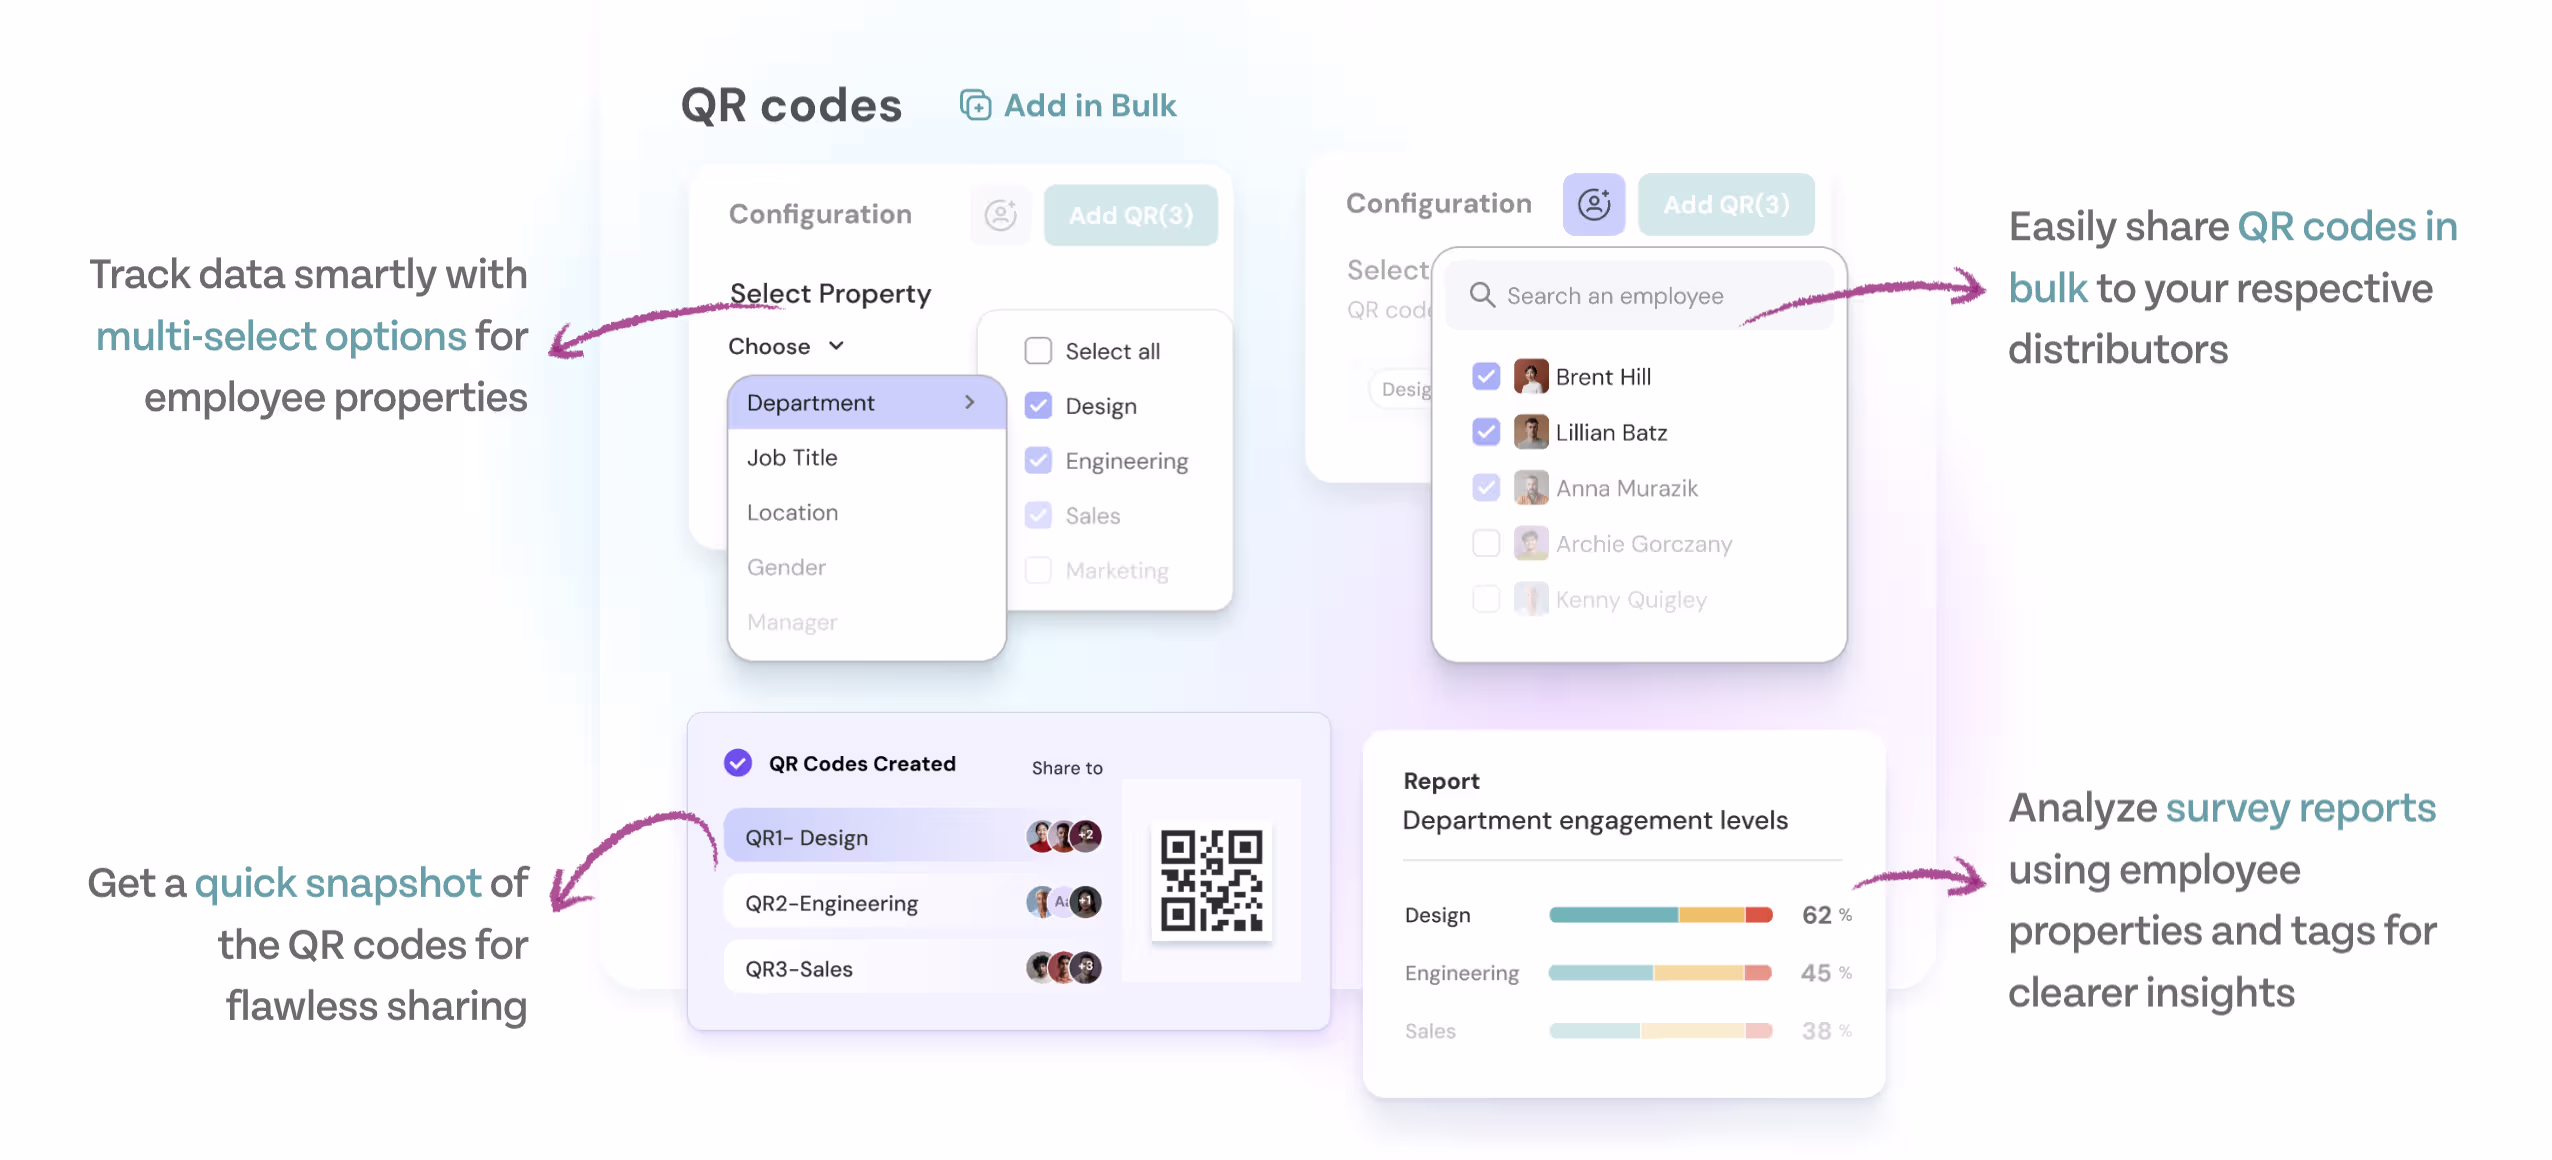
The simplest fix I have seen work consistently is the QR code survey. Operators scan a code at the start or end of their shift, answer three to five questions, and they are done. No login. No email. No HR portal. ThriveSparrow's QR-based deployment achieves 90% completion rates or above in manufacturing environments where email surveys get 28 to 40%.
That difference in data quality changes everything. You cannot build a reliable engagement picture from a 30% response rate. You cannot confidently say a shift team is disengaging or re-engaging if 70% of them never answered the survey. Get the response rate right first. Everything else follows.
The Channel was always the problem. Not the people.
The Five Mistakes Large Manufacturing Organizations Make Repeatedly
1. Using the same review template for a machine operator and a plant manager.
These are fundamentally different roles with different performance dimensions. A single template produces reviews that feel irrelevant to everyone. Build role-specific templates with a shared core covering safety and attendance, and role-specific operational sections for each level.
2. Measuring activity instead of outcomes.
Counting training sessions attended is not measuring development. Measuring the reduction in changeover time after a SMED certification is measuring development. Every metric in your performance system should connect to a visible result on the floor.
3. Reporting at plant level and hiding shift-level problems.
A plant averaging 82% OEE with a day shift at 91% and a night shift at 73% has a serious performance management problem. The night shift problem will never get addressed if it is invisible in the data. Segment everything by shift.
4. Building no recognition infrastructure for blue-collar workers.
SHRM data shows 79% of workers who quit cite lack of appreciation as a primary reason. In manufacturing, where the work is physically demanding and often thankless, recognition matters more than most HR leaders realize. It does not have to be elaborate. It has to be consistent and specific.
5. Positioning performance management as an HR compliance exercise.
When plant managers see performance management as paperwork HR needs done, adoption collapses. When they see it as a tool that improves their OEE numbers, reduces the turnover that disrupts their shift coverage, and builds the supervisor capability they have been asking for, they become your biggest advocates.
Final Thoughts
Every HR leader in my network who has cracked manufacturing performance management says the same thing. They did not do it by importing a framework from somewhere else and hoping it would translate. They did it by starting with the reality of how their blue-collar workforce actually works and building backward from there.
The shop floor is not an office. The blue-collar workers running your production lines are not knowledge workers. And the performance management system you build for them should not feel like it was designed for someone else.
If one thing in this guide is useful to you, I hope it is this: your engagement data is a leading indicator of your OEE. Start tracking it by shift, act on it early, and you will be managing performance instead of reacting to it.
FAQS
1. What is performance management in manufacturing?
Performance management in manufacturing sets clear expectations, tracks production KPIs, and provides regular feedback to frontline workers and supervisors. It connects operational metrics like OEE and scrap rate with people metrics such as engagement and skill certification to improve both productivity and workforce development.
2. What are the most important KPIs in manufacturing performance management?
Key operational KPIs include OEE, First Pass Yield, Scrap Rate, On-Time Delivery, and Cycle Time. Important people KPIs include absenteeism by shift, turnover by shift, safety incidents, training completion rate, and frontline engagement scores.
3. How do you calculate OEE in manufacturing?
OEE is calculated as Availability × Performance × Quality. Availability measures machine uptime, Performance measures output speed, and Quality measures defect-free production. World-class OEE is typically 85% or higher.
4. What is KPI lean manufacturing and why does it matter for HR leaders?
Lean manufacturing KPIs focus on eliminating waste and improving efficiency. Metrics like Takt Time, First Pass Yield, and Changeover Time help HR align workforce programs with operational performance goals.
5. How do you improve performance management for shift workers and blue-collar crews?
Replace annual reviews with quarterly check-ins designed for shift work. Use quick pulse surveys, segment data by shift, and train supervisors in coaching conversations while embedding recognition into daily operations.

