infer ai - Highlights
AI insights that show you where to act — and why
Don’t just look at survey data charts. Let AI break down engagement and performance signals into clear, actionable takeaways that empower leaders to act fast and act smart.
Book a Demo

JOIN THE BEST BRANDS IN THE WORLD




Turn survey results into a decision-making playbook
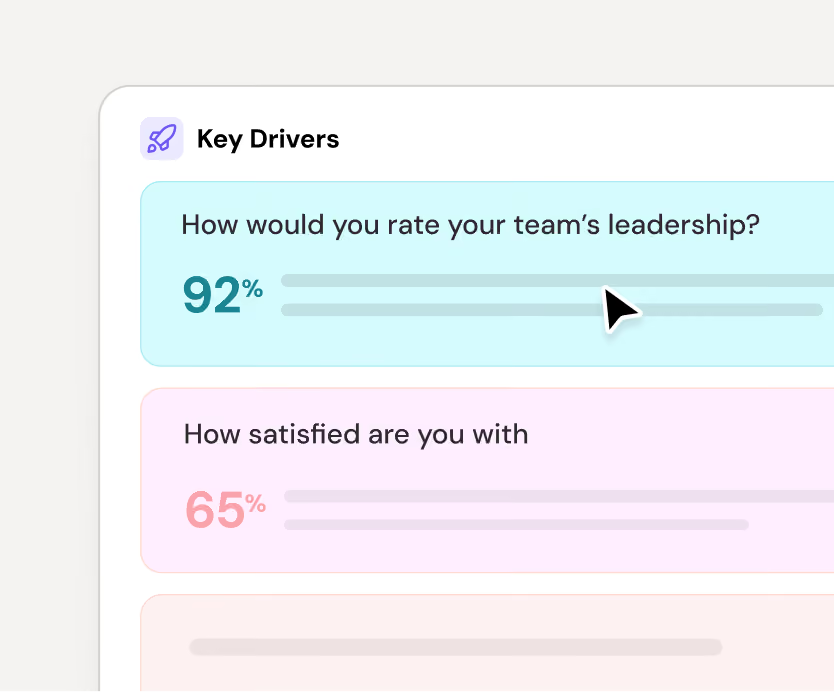
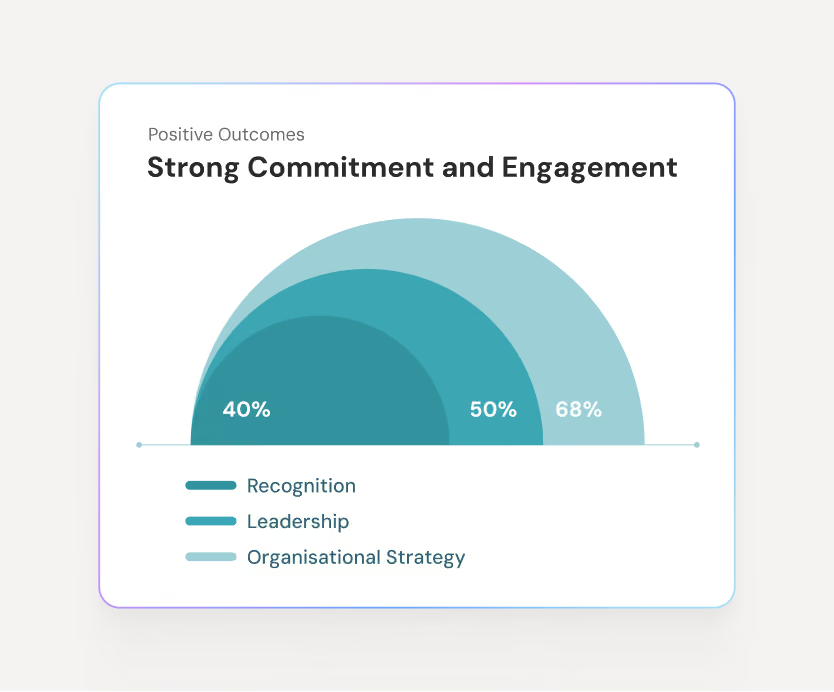
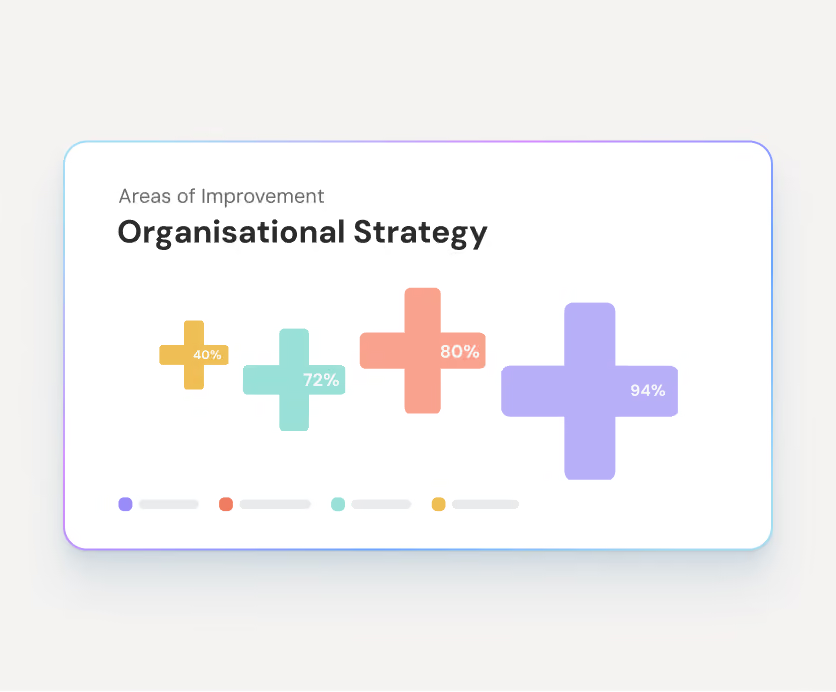
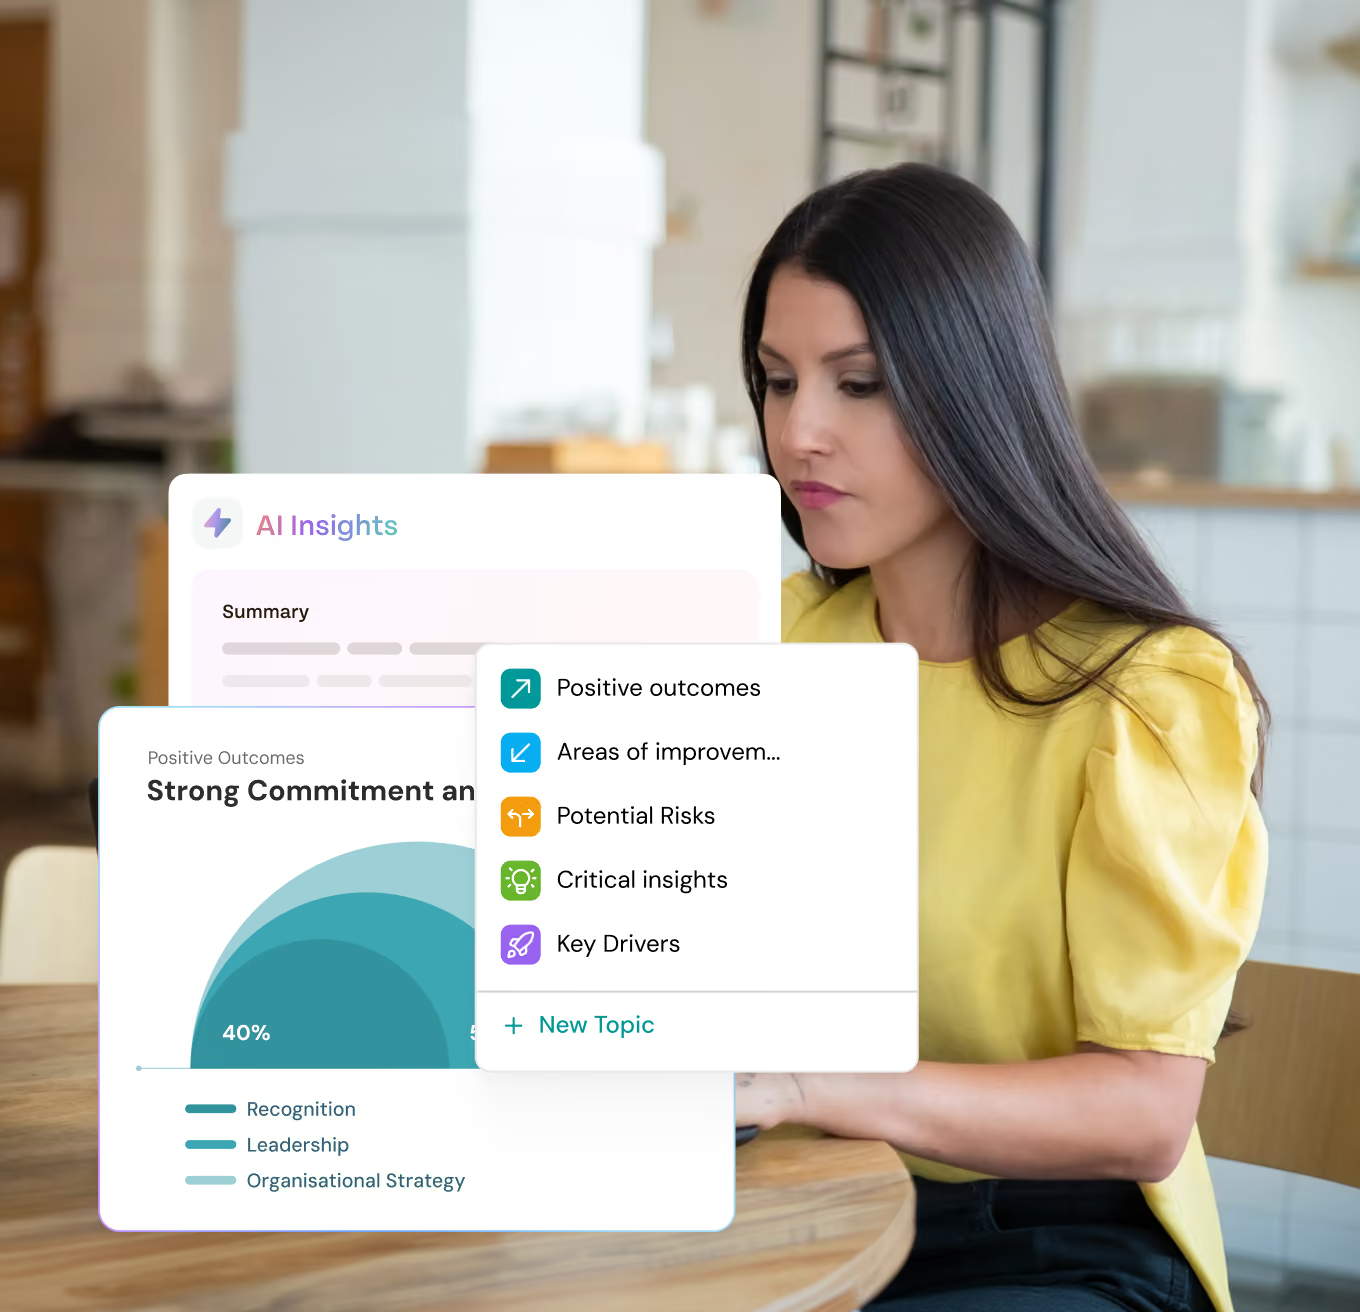
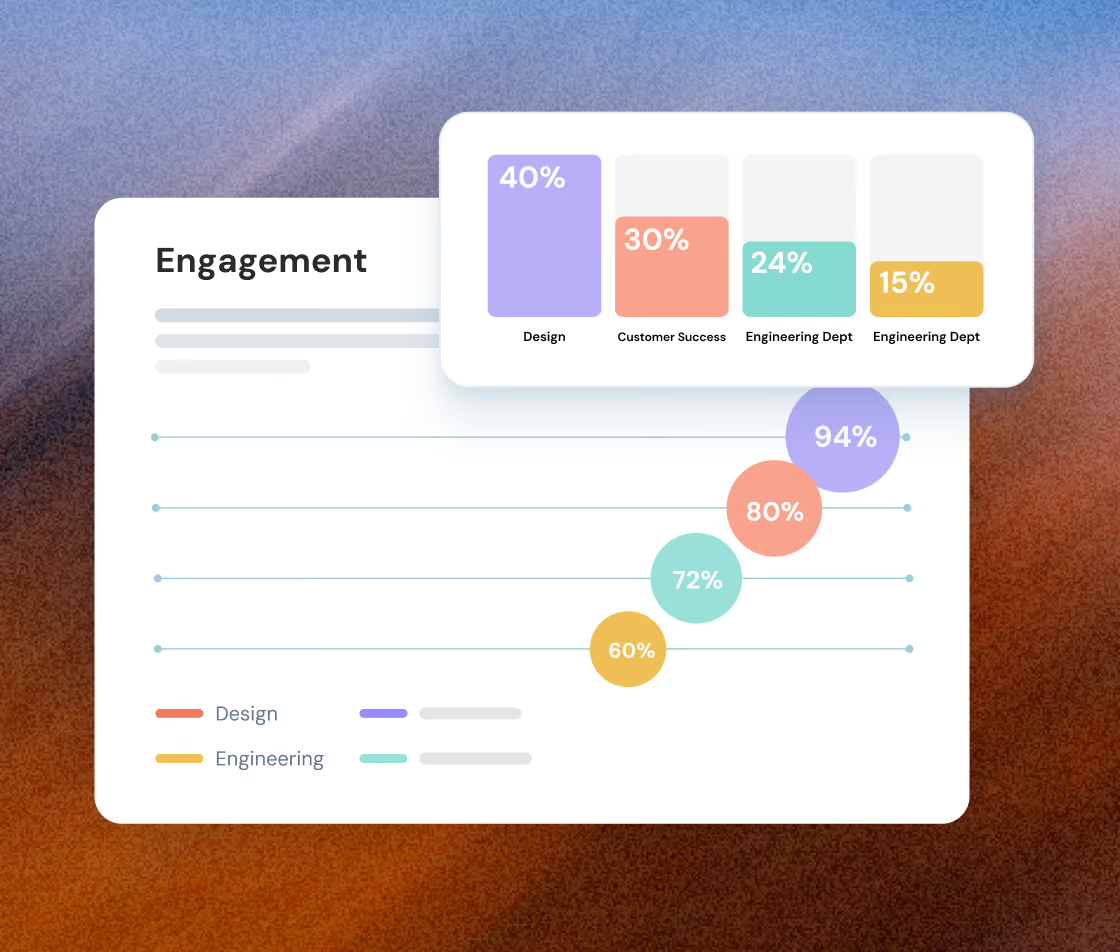
Get a bird’s-eye view of your group’s engagement level
No more sifting through endless data—get clear engagement insights instantly.

Get instant, AI-powered summaries with themes, sentiment and patterns, eliminating guesswork.
Empower your leaders to dive deeper with AI follow-ups and focus their efforts on what actually matters.
Book a Demo
Get to the root of performance trends
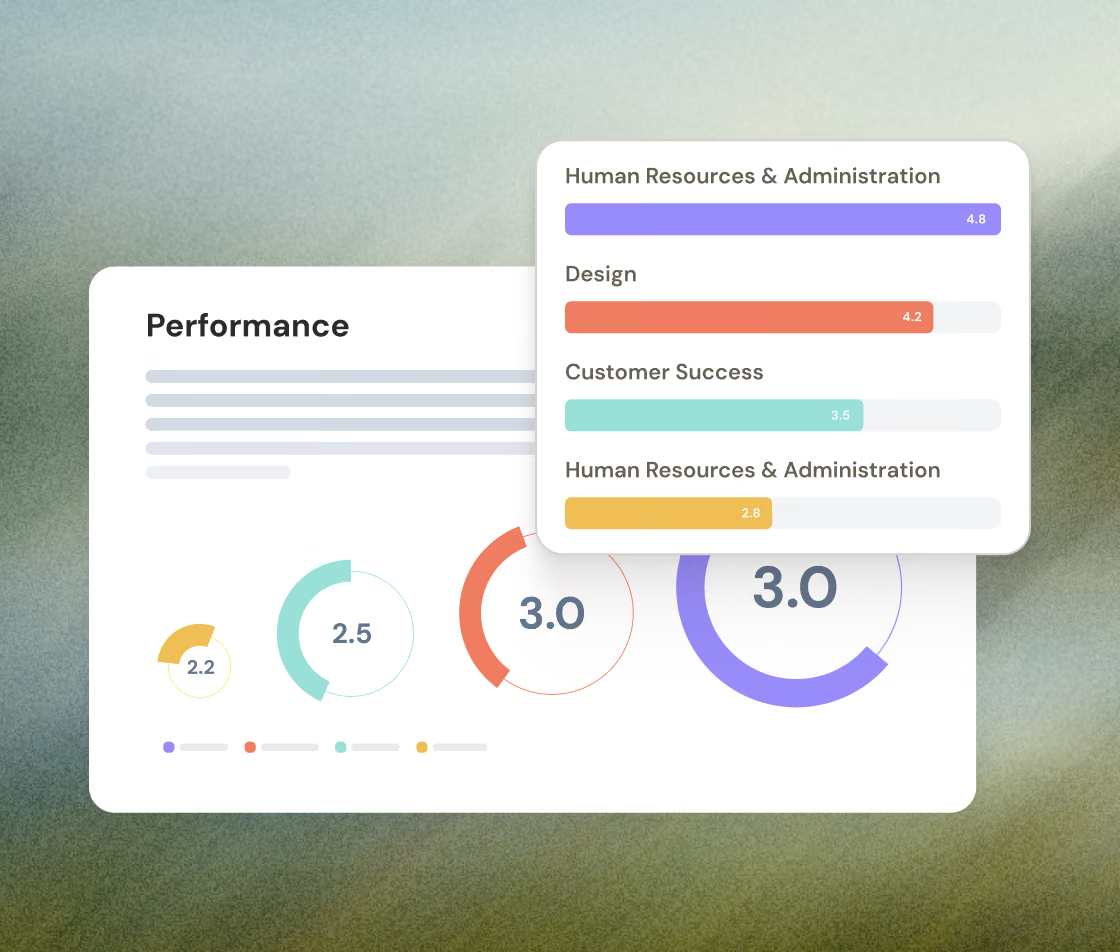
Spot high performers and struggling teams instantly with AI-curated insights that show you exactly where to lean in.
Pinpoint what’s driving performance across roles, locations and competencies, without lifting a finger.
Dig deeper into performance trends to guide leaders and teams with visual, insight-backed summaries.
Book a Demo
Turn insights into action with AI-powered plans
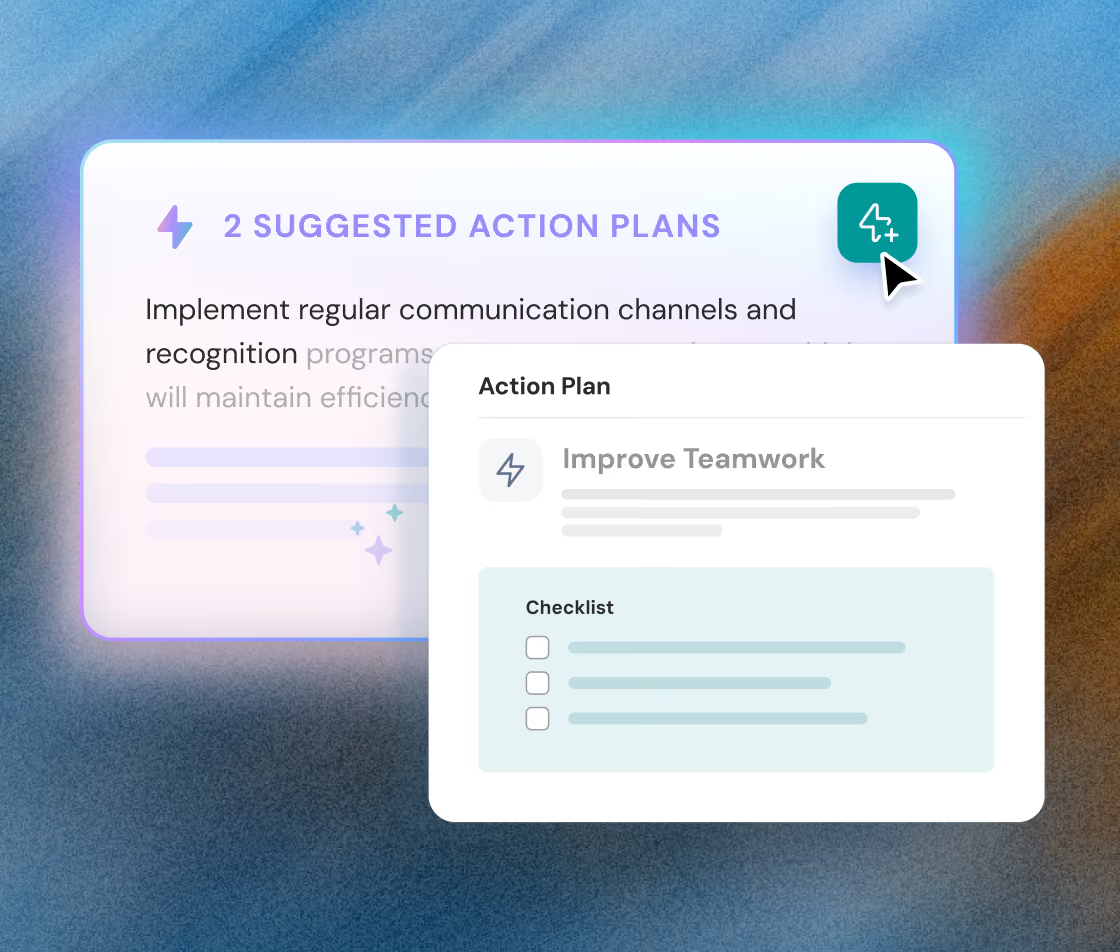
Act immediately with AI-powered plans that don’t just show you what’s wrong, they tell you exactly how to fix it, instantly.
Get AI-generated action plans mapped to your insights — ready to roll, right out of the box.
Bridge the gap between insight and execution with AI plans that turn reflection into real results.
Book a Demo
TESTIMONIAL
Our customers' wins are our wins too, from day one

Nitika Malik
Manager, Global Learning & Development, APL Logistics
I would recommend ThriveSparrow while standing on the top of a building. The platform's ease of use & outstanding customer service deliver exactly what every professional needs.
75%
increase in self-completed
evaluations



Lydia
HR Project Manager, Dyninno
ThriveSparrow brought structure and transparency to our processes, cut our manual work by almost 70% and improved the quality of feedback we receive.
70%
reduction in manual
HR work


Ramalingam Thiagarajan
Head Corporate HR, TVS Sensing Solutions
Before ThriveSparrow, our 360-degree feedback process was slow and exhausting. Now, it's smooth, saves weeks of effort, and gives us deep, actionable leadership insights.
96.8%
survey response rate


Jessica Downing
People & Culture, Uniting
I appreciate the support I've received from the ThriveSparrow team. The platform is easy to use, the automation saves me weeks of work, and the reporting is incredibly polished.
200+
360° reports delivered without manual work
evaluations


Becki Chetwood
Head of People and Culture, SysGroup
ThriveSparrow is simple, supportive, and fun. I love it. I'd give it a 9 out of 10. It's so easy to use, and the dashboards and engagement insights make such a difference.
85%
active adoption across
the business


The What, Why & How of Highlights
What ?
Gives insights that are already summarized, sorted and ready to use - no digging, no decoding.
Why ?
Because manually interpreting reports slows everything down, Infer AI tells you what matters and why.
How ?
Reads your data, spots patterns and hands you instant summaries, comparisons, and action plans
Got questions?
We're right here!
What is Infer AI or Highlights?
It’s an AI-powered reporting tool that transforms employee engagement and performance data into clear, actionable insights — no manual effort required.
Who benefits from using this feature?
HR leaders, managers, and executives who need to make data-backed decisions, spot performance trends, and respond to engagement challenges in real-time.
Can I filter insights by department, tenure, or location?
Yes. Use built-in filters or custom properties to segment employee feedback and performance insights by any group — from departments to business units.
Make everyday a success story for your people
Book a demo