text insights

Uncover Employee Sentiment with AI-powered Text Insights

Gather insights, identify areas for improvement, and create actionable plans to boost employee engagement and performance.
Book a Demo
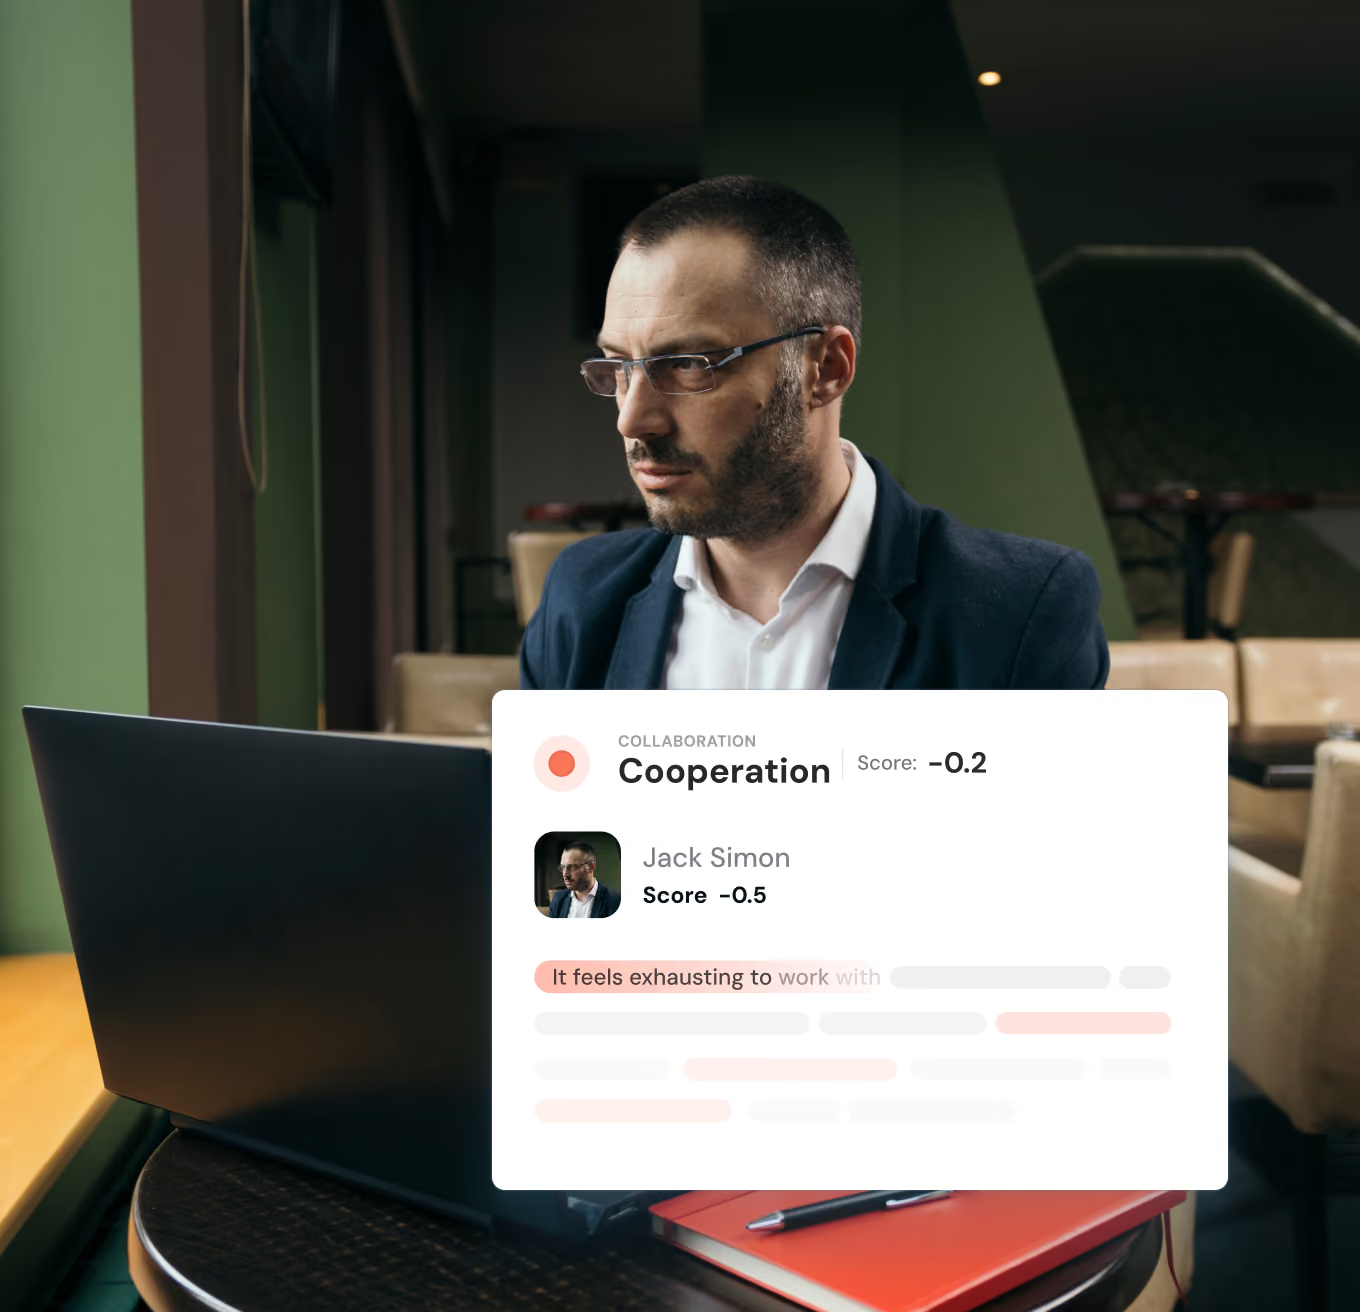
Man wearing glasses and a dark blazer sitting at a table with a laptop and notebooks, looking thoughtfully to his left, with a digital overlay showing a collaboration sentiment analysis score of -0.2, and a profile for Jack Simon with a score of -0.5 and highlighted text stating 'It feels exhausting to'.
JOIN THE BEST BRANDS IN THE WORLD
active interest media logo
tech mahindra logo
dummen orange logo
tropicana logo
active interest media logo
tech mahindra logo
dummen orange logo
tropicana logo
Listen between the lines : Understand the nuances of employee sentiments with AI

Understand Microscopic Sentiment with Individual Responses

Explore individual feedback within each sub-topic to make sure you don't miss the details.
arrow right icon
The Responses tab lets you get into the individual comments for each sub-topic.
arrow right icon
This granular analysis helps you capture the true sentiment behind the feedback and take targeted action.
Book a Demo
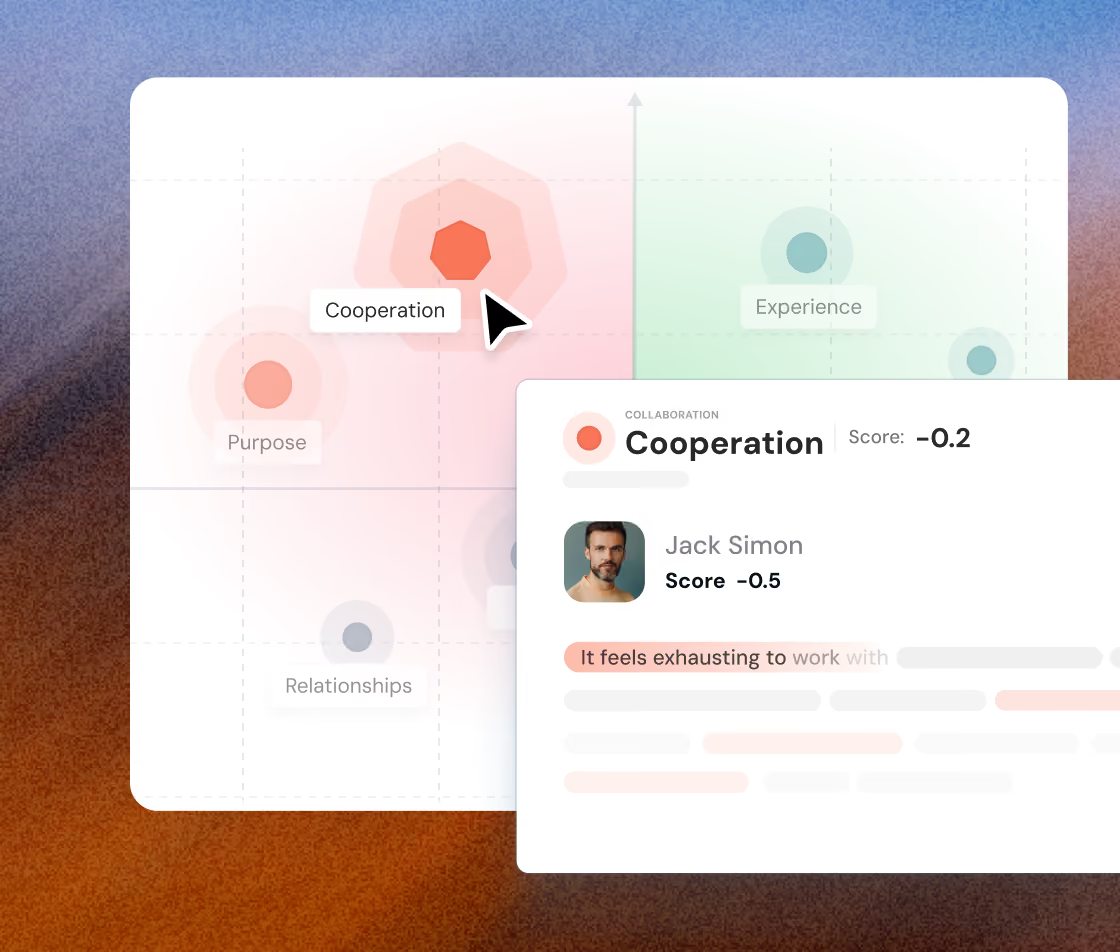
Interface showing a collaboration analysis chart with labeled categories: Cooperation, Purpose, Experience, and Relationships. A cursor highlights Cooperation, which has a score of -0.2. A profile of Jack Simon is displayed, showing his Cooperation score as -0.5 with a comment saying it feels exhausting to work.

See It All, Act on What Matters

Get a clear visualization of the pressing issues, areas for improvement, and opportunities to leverage strengths.
arrow right icon
Gain instant insights to address what matters most at the moment.
arrow right icon
Take immediate action to create a more engaged and productive work environment.
Book a Demo
Interface showing a collaboration analysis chart with labeled categories: Cooperation, Purpose, Experience, and Relationships. A cursor highlights Cooperation, which has a score of -0.2. A profile of Jack Simon is displayed, showing his Cooperation score as -0.5 with a comment saying it feels exhausting to work.

Drill Down for Specific Topic Analysis
Let’s now stop at the surface when it comes to employee sentiments.
arrow right icon
ThriveSparrow's sentiment analysis lets you click on any factor to explore deeper.
arrow right icon
Uncover focused insights into specific topics and understand the nuances of your employee feedback.
Book a Demo
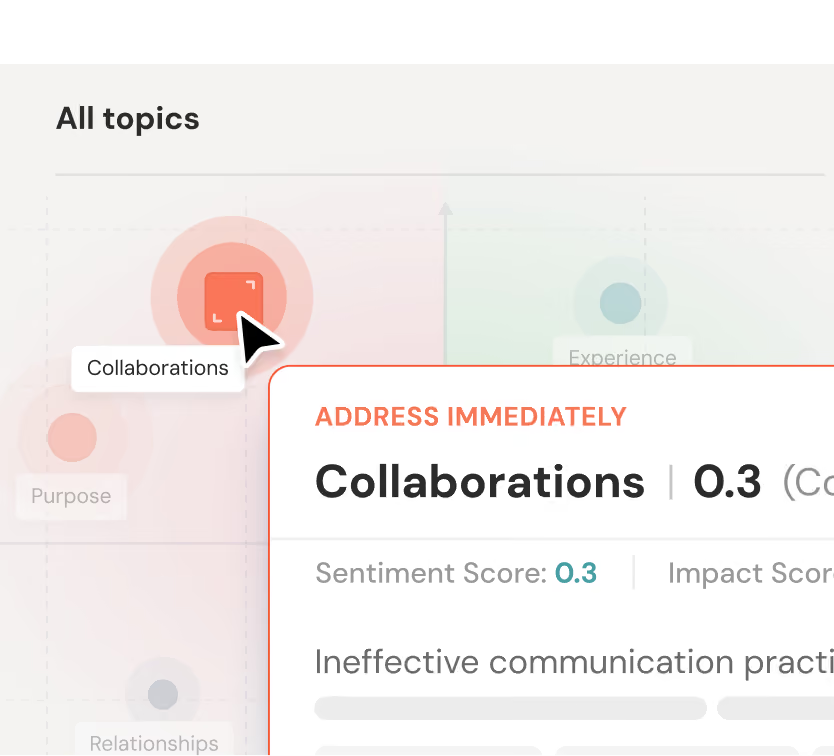
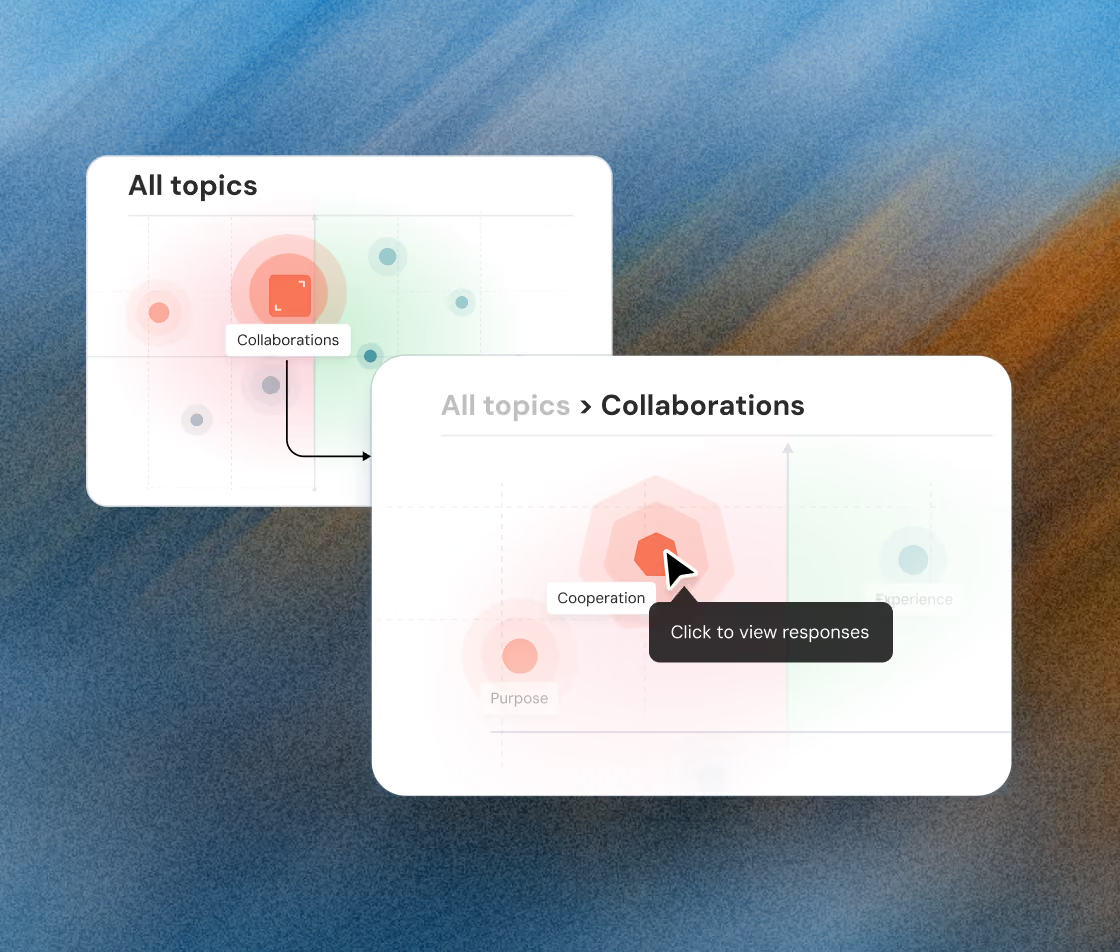
User interface showing two interactive sentiment analysis charts on a blue and brown textured background; the first chart titled 'All topics' highlights 'Collaborations,' and the second zooms into 'Collaborations' with a pointer hovering over 'Cooperation' and a tooltip reading 'Click to view responses.'
TESTIMONIAL

Our customers' wins are our wins too, from day one

Portrait of a smiling woman with long dark hair wearing a light-colored top.
Nitika Malik
Manager, Global Learning & Development, APL Logistics
I would recommend ThriveSparrow while standing on the top of a building. The platform's ease of use & outstanding customer service deliver exactly what every professional needs.
75%
increase in self-completed
evaluations
Warehouse worker in safety vest and helmet holding clipboard amid shelves with boxes and pallets.
Lydia
HR Project Manager, Dyninno
ThriveSparrow brought structure and transparency to our processes, cut our manual work by almost 70% and improved the quality of feedback we receive.
70%
reduction in manual
HR work
Four diverse professionals gathered around a laptop in a modern office setting.
Man with short dark hair and beard wearing a striped beige shirt looking to the side smiling.
Ramalingam Thiagarajan
Head Corporate HR, TVS Sensing Solutions
Before ThriveSparrow, our 360-degree feedback process was slow and exhausting. Now, it's smooth, saves weeks of effort, and gives us deep, actionable leadership insights.
96.8%
survey response rate
Two professionals collaborating at a computer workstation in a modern industrial office space.
Smiling woman with wavy dark hair and natural makeup wearing a blue top.
Jessica Downing
People & Culture, Uniting
I appreciate the support I've received from the ThriveSparrow team. The platform is easy to use, the automation saves me weeks of work, and the reporting is incredibly polished.
200+
360° reports delivered without manual work
evaluations
Four people engaged in a discussion in a casual office setting with a chalkboard in the background.
Close-up of a woman with light makeup and light brown hair looking at the camera.
Becki Chetwood
Head of People and Culture, SysGroup
ThriveSparrow is simple, supportive, and fun. I love it. I'd give it a 9 out of 10. It's so easy to use, and the dashboards and engagement insights make such a difference.
85%
active adoption across
the business
Business meeting with three people clapping a standing woman presenting in an office.
forward arrowforward arrow

The What, Why & How of Text Insights

What ?
Employee sentiment analysis is the process of gathering and analyzing feedback to gauge the hidden emotions of your workforce.
Why ?
Understanding employee sentiment helps you identify underlying issues, improve morale, and foster a positive workplace culture.
How ?
Collect feedback, analyze it with AI, and regularly review insights to make proactive and informed decisions for your organization.

Got questions?
We're right here!

Why should my organization conduct employee sentiment analysis?

Happy employees = less turnover, better performance, and stronger engagement. Sentiment analysis helps you create that happiness by uncovering concerns early.

How often should I conduct sentiment analysis?

There's no one-size-fits-all answer. Consider a mix of:

1. Regular surveys: Capture general sentiment trends. (e.g., quarterly)

2. Pulse checks: Monitor specific issues or during times of change. (e.g., monthly)

3. Exit interviews: Gain insights from departing employees. (every exit)

How does the scatter map work?

The scatter map visually represents the impact and sentiment of employees for various key factors. It allows you to quickly identify areas that need the most attention.

What happens after I receive the sentiment analysis report?

The report is just the beginning! Turn them into action by prioritizing high-impact issues, developing action plans, communicating progress, and iterating based on results.

Make everyday a success story for your people

Book a demo
46% with an upward arrow above, followed by text stating employees know what is expected of them at work, attributed to Gallup.
Graphic showing 85% of employees are not engaged in their workplace, attributed to Gallup.
Graphic showing $438 billion loss to the world economy due to poor workforce engagement, attributed to Gallup.
Lorem Ipsum