ENPS
Strengthen workplace advocacy through eNPS surveys
Measure employee loyalty and minimize attrition by harnessing the power of the employee net promoter score survey for your organization’s success.
Book a Demo


JOIN THE BEST BRANDS IN THE WORLD




Fueling employee morale and retention to amplify team engagement
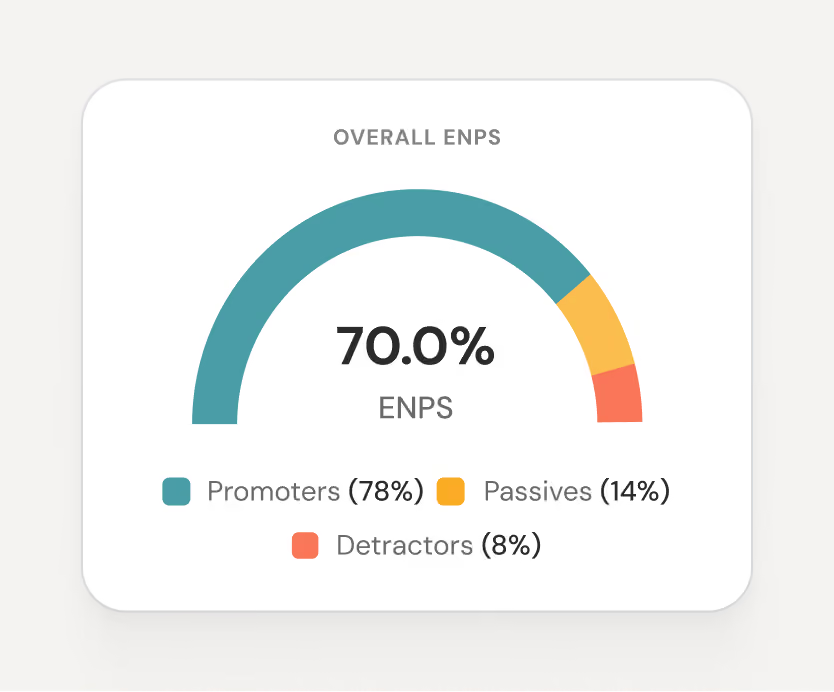
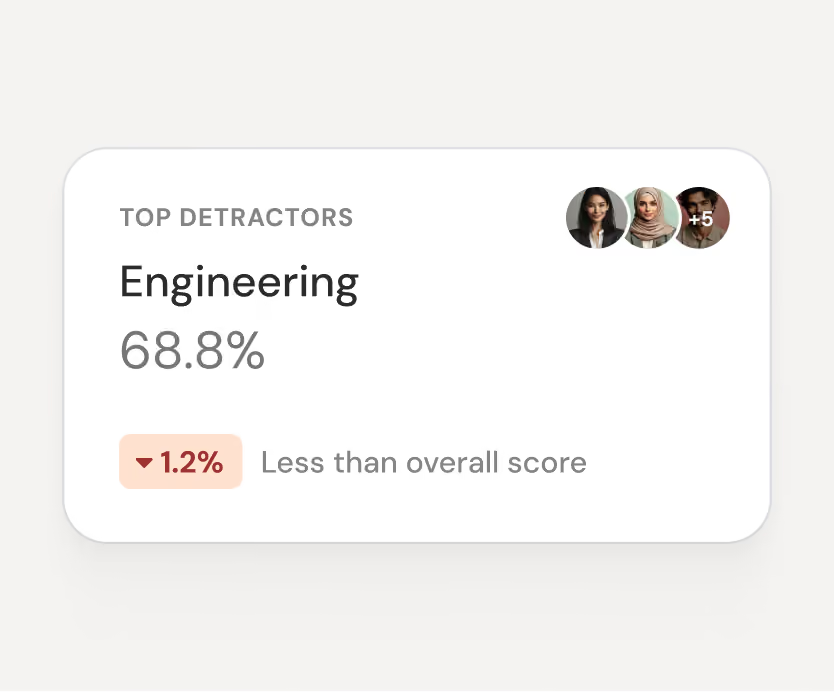
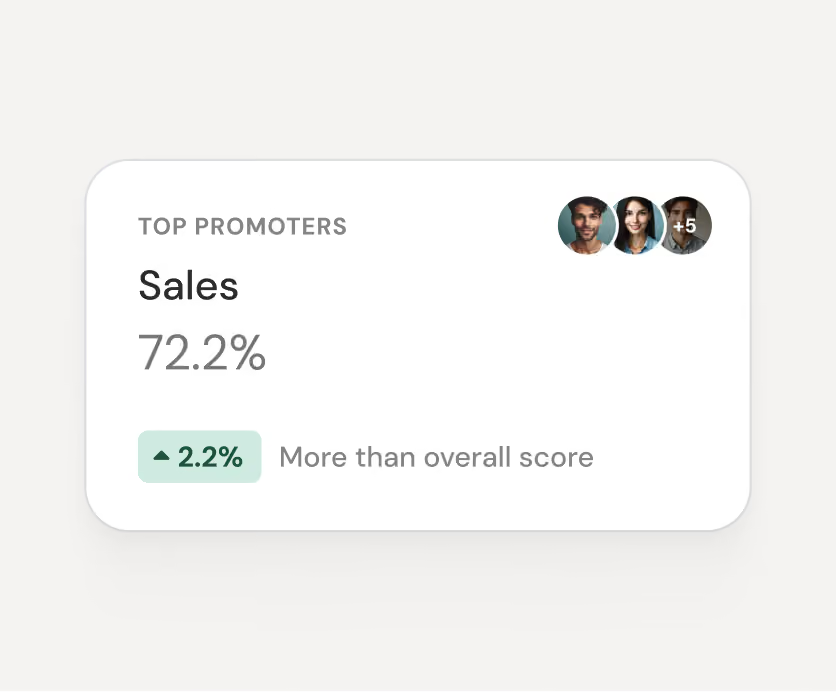
Tap into employee sentiments with the eNPS golden question
Delve into employee insights using the eNPS question as your guide. Enrich clarity with other supporting questions for a complete picture.

Identify your loyal advocates who are eager to recommend it to others.
Spot and improve key areas by addressing identified shortcomings.
Book a Demo
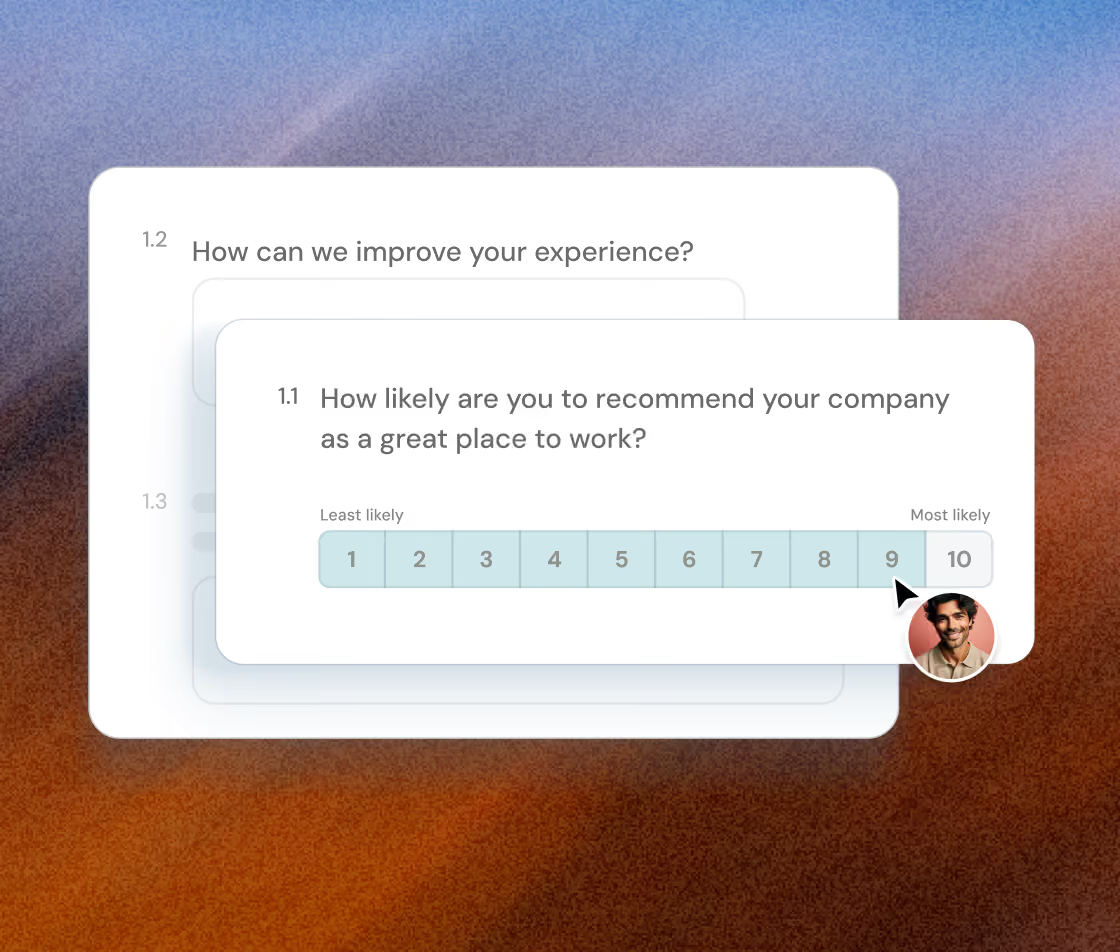
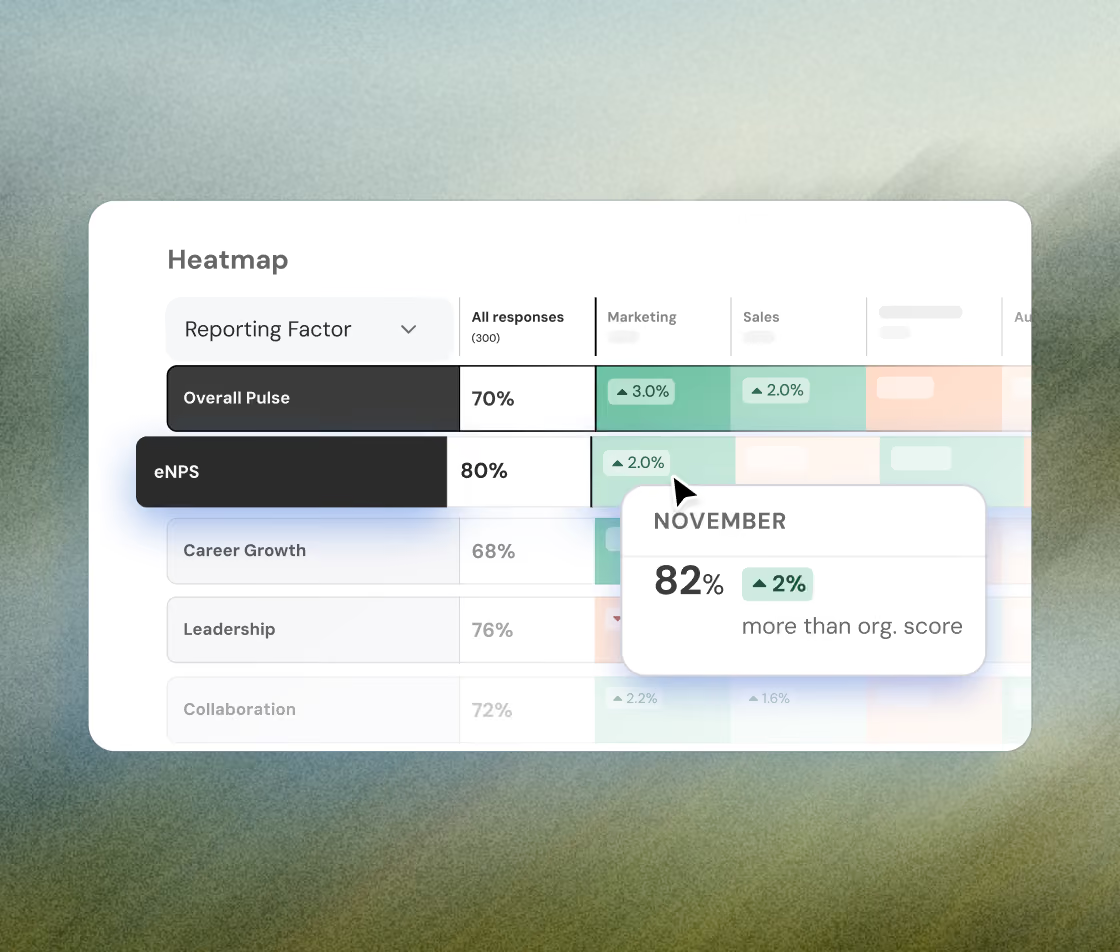
Get a panoramic view & improve workforce sentiment with interactive heatmap
Use your organizational score as a benchmark to pinpoint departments with the lowest and highest eNPS scores, driving targeted improvements and recognition.
Gain clarity on pressing issues and opportunities to leverage strengths visually.
Utilize heatmap-driven insights to focus actions on areas with varying organizational sentiment levels.
Book a Demo
Monitor and analyze the pulse of your employee happiness
Trace shifts in employee satisfaction & loyalty across organizational segments against various time frames.
Analyze upward trends to identify successful practices for replication in areas needing improvement.
Monitor declining areas to implement targeted initiatives & enhance overall employee advocacy.
Book a Demo

Act on eNPS data to skyrocket employee happiness and loyalty
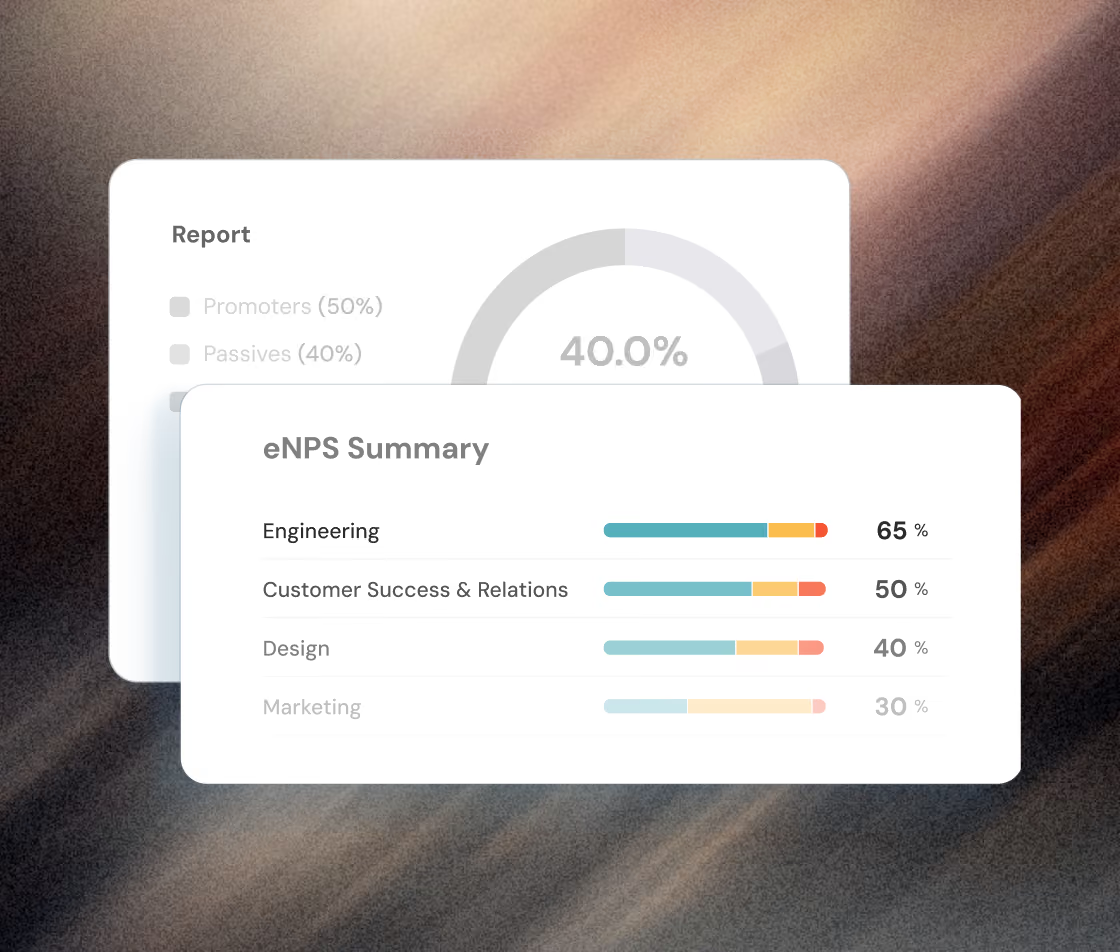
Get a summarized view of the percentage of different employee groups likely to stay loyal and committed.
Leverage the improved zones to replicate effective strategies for a highly engaged, productive team.
Drive employee loyalty by prioritizing urgent initiatives & addressing key areas.
Book a Demo
TESTIMONIAL
Our customers' wins are our wins too, from day one

Nitika Malik
Manager, Global Learning & Development, APL Logistics
I would recommend ThriveSparrow while standing on the top of a building. The platform's ease of use & outstanding customer service deliver exactly what every professional needs.
75%
increase in self-completed
evaluations



Lydia
HR Project Manager, Dyninno
ThriveSparrow brought structure and transparency to our processes, cut our manual work by almost 70% and improved the quality of feedback we receive.
70%
reduction in manual
HR work


Ramalingam Thiagarajan
Head Corporate HR, TVS Sensing Solutions
Before ThriveSparrow, our 360-degree feedback process was slow and exhausting. Now, it's smooth, saves weeks of effort, and gives us deep, actionable leadership insights.
96.8%
survey response rate


Jessica Downing
People & Culture, Uniting
I appreciate the support I've received from the ThriveSparrow team. The platform is easy to use, the automation saves me weeks of work, and the reporting is incredibly polished.
200+
360° reports delivered without manual work
evaluations


Becki Chetwood
Head of People and Culture, SysGroup
ThriveSparrow is simple, supportive, and fun. I love it. I'd give it a 9 out of 10. It's so easy to use, and the dashboards and engagement insights make such a difference.
85%
active adoption across
the business


The What, Why & How of eNPS Surveys
What ?
Measures employees' likelihood to recommend their workplace to others.
Why ?
Provides insight into employee loyalty and a higher eNPS indicates a positive work environment.
How ?
By subtracting the % of Promoters with % of Detractors and multiplying it by 100, we get the eNPS score.
Got questions?
We're right here!
What does a good eNPS score indicate?
A positive eNPS score indicates that there are more Promoters than Detractors within the organization.
What does the eNPS scale signify?
Responses are categorized into Promoters (9-10), Passives (7-8) and Detractors (0-6).
What role does employee engagement play in eNPS scores?
It plays an indispensable role as higher engagement often correlates with higher eNPS scores.
What is the significance of anonymity in eNPS surveys?
Anonymity in eNPS surveys encourages honest feedback, crucial for gaining valuable insights and driving meaningful change within the organization.
What is a good enps score?
A good eNPS score typically ranges from 10 to 30, with scores above 30 considered excellent, and scores above 50 seen as exceptional.
Make everyday a success story for your people
Book a demo