

Most companies track diversity headcount. How many women? How many underrepresented employees? What does the leadership team look like?
But representation alone doesn't show whether employees feel included, supported, promoted fairly, heard, or safe at work.
That's where many DEI programs get stuck. The numbers may look fine on paper, but employees may still experience unequal growth opportunities, lower belonging, biased reviews, or higher turnover.
DEI metrics help organizations measure whether diversity, equity, and inclusion efforts are creating meaningful workplace change — not just demographic shifts on paper.
This guide covers the most important DEI metrics to track, including workforce representation, hiring diversity, promotion equity, retention by demographic group, pay equity, inclusion scores, belonging scores, and psychological safety. You'll also find formulas, dashboard examples, and step-by-step guidance to measure DEI success across hiring, growth, compensation, engagement, and retention.
DEI Metrics at a Glance
What are DEI metrics?
DEI metrics are measurable indicators that help organizations track diversity, equity, inclusion, and belonging across hiring, promotion, retention, pay, leadership, and employee experience.
DEI metrics are data points that measure diversity, equity, and inclusion across the employee lifecycle — from hiring and promotion to retention and employee experience.
Diversity metrics track representation across demographic groups like gender, race, ethnicity, age, disability, and other dimensions.
Equity metrics measure fairness in outcomes — like whether employees from different backgrounds receive equal pay, promotion rates, and performance ratings.
Inclusion metrics measure employee experience — whether people feel valued, heard, safe, and able to contribute fully at work.
Together, these metrics help HR teams identify gaps, track progress, and turn DEI from an initiative into measurable workplace change.
Why DEI metrics matter
DEI metrics matter because you can't improve what you don't measure.
Without data, DEI becomes anecdotal. With data, you can identify patterns, set goals, and hold leadership accountable.
SHRM DEI Research also emphasizes that organizations need measurable DEI benchmarks to identify gaps in representation, inclusion, and employee opportunity.
Here's what DEI metrics help organizations do:
1. Identify representation gaps. You can't fix underrepresentation if you don't know where it exists. Metrics show which departments, levels, and roles lack diversity.
2. Detect hiring bias. If diverse candidates drop off at specific interview stages, your hiring process has a problem. Metrics help you find it.
3. Uncover promotion barriers. If underrepresented employees are promoted at lower rates than their peers, something's blocking advancement. Metrics reveal the pattern.
4. Spot retention risks. If certain demographic groups leave at higher rates, the work environment isn't working for them. Metrics surface the warning signs early.
5. Measure inclusion, not just representation. Hiring diverse employees means nothing if they don't feel included. Metrics like belonging scores and psychological safety show whether people actually feel safe and valued.
6. Drive accountability. When DEI metrics are tied to leadership goals, they stop being optional. Leaders can't ignore what's being measured.
7. Benchmark progress. Metrics let you compare this year to last year, this department to that department, your company to industry benchmarks.
DEI without metrics is good intentions. DEI with metrics is measurable change.
DEI metrics vs diversity metrics vs inclusion metrics
People use these terms interchangeably, but they're not the same.
When people say "diversity metrics," they usually mean representation. When they say "inclusion metrics," they usually mean employee sentiment. DEI metrics cover all three.
What makes a good DEI metric?
A good DEI metric should be measurable, tied to a real business or employee experience outcome, and clear enough for leaders to act on.
Weak metric: Number of DEI events hosted
Strong metric: Change in belonging score after a DEI initiative
Weak metric: Number of diverse candidates sourced
Strong metric: Candidate conversion rate by demographic group across each hiring stage
The difference? Strong metrics measure outcomes and reveal whether DEI efforts are working. Weak metrics measure activity and look good in reports but don't show impact.
Weak vs. Strong DEI Metrics
15 DEI metrics and KPIs every HR team should track
These are the metrics that matter most. Some are quantitative (representation, pay equity). Some are qualitative (belonging, psychological safety). Organizations that track both get the full picture.
1. Workforce representation
What it measures: The percentage of employees from different demographic groups across the organization, by department, and by level.
Why it matters: Representation is the foundation. You need to know who's in the building before you can measure whether they're being treated fairly.
Formula:
Example: If 45 out of 150 employees are women, workforce representation for women is 30%.
How to read it: If representation is healthy at entry level but weak at leadership level, the issue may not be hiring. It may be promotion, sponsorship, or manager bias.
What to watch for: Representation gaps at senior levels. Many companies have diverse entry-level teams but lack diversity in leadership. That's a promotion equity problem, not a hiring problem.
2. Leadership diversity
What it measures: The percentage of leaders from underrepresented groups at director level and above.
Why it matters: Leadership diversity signals whether advancement paths are equitable. McKinsey Diversity Research continues to show a strong relationship between diverse leadership teams and business performance.
Formula:
Example: If 3 out of 15 directors are from underrepresented ethnic groups, leadership diversity is 20%.
How to read it: If leadership diversity lags behind overall workforce diversity by more than 10 percentage points, promotion barriers or sponsorship gaps may be blocking advancement.
What to watch for: Tokenism. One diverse executive doesn't mean equitable leadership. Track representation across all senior roles, not just C-suite optics.
3. Hiring pipeline diversity
What it measures: The percentage of diverse candidates at each stage of the hiring funnel — application, phone screen, interview, offer, acceptance.
Why it matters: If diverse candidates drop off at specific stages, your hiring process has bias baked in. Metrics show where the problem starts.
Formula:
Example: If 40% of applicants are diverse but only 20% make it to final interviews, your interview process is filtering them out.
How to read it: Compare pipeline percentages stage by stage. If diverse candidates pass initial screens but drop off during panel interviews, the panel composition or interview structure may need review.
What to watch for: Drop-off points. If diverse candidates pass phone screens but fail panel interviews, the panel might have bias problems.
4. Selection rate by demographic group
What it measures: The percentage of candidates from each demographic group who receive job offers compared to those who apply.
Why it matters: Selection rates reveal whether hiring decisions favor certain groups over others. Equal representation in the applicant pool means nothing if selection rates are unequal.
Formula:
Example: If 30 women apply and 6 are hired, the selection rate is 20%. If 30 men apply and 12 are hired, the selection rate is 40%. That's a hiring equity problem.
How to read it: Compare selection rates across demographic groups. If one group's rate is significantly lower than another's, review interview scorecards, hiring manager patterns, and decision-making criteria.
What to watch for: The "four-fifths rule." If one group's selection rate is less than 80% of another group's rate, that's a red flag for potential bias. The EEOC's Uniform Guidelines on Employee Selection Procedures commonly reference the four-fifths rule as an indicator for potential adverse impact in hiring decisions.
5. Promotion rate by demographic group
What it measures: The percentage of employees from each demographic group who are promoted within a given time period.
Why it matters: Promotion equity reveals whether advancement opportunities are fair. If underrepresented employees are promoted at lower rates, something's blocking their career growth.
Formula:
Example: If 10 out of 50 women are promoted and 20 out of 50 men are promoted, women have a 20% promotion rate and men have a 40% promotion rate. That's inequitable.
How to read it: Track promotion rates over time and across departments. If rates are unequal in specific teams but equal company-wide, manager behavior may be the variable.
What to watch for: Manager bias. If promotion rates are equal in some departments but unequal in others, specific managers might be the problem.
6. Retention rate by demographic group
What it measures: The percentage of employees from each demographic group who stay with the company over a given time period.
Why it matters: Retention rates reveal whether employees feel included, valued, and supported. If underrepresented employees leave at higher rates, the work environment isn't working for them.
Formula:
Example: If 80 out of 100 underrepresented employees remain after one year, retention is 80%. If 95 out of 100 majority employees remain, retention is 95%. That gap signals a belonging problem.
How to read it: If one group has lower retention than others, compare it with engagement, belonging, manager feedback, and exit survey themes before deciding the cause.
What to watch for: Early exits. If underrepresented employees leave within the first year, onboarding or early inclusion efforts are failing.
7. Pay equity ratio
What it measures: Whether employees from different demographic groups receive equal pay for equal work.
Why it matters: Pay equity is table stakes. If employees from one demographic group are paid less than peers in similar roles, levels, and performance bands, that may point to a serious pay equity issue that needs deeper review.
Formula:
Example: If women in engineering roles earn an average of $95,000 and men earn an average of $100,000, the pay equity ratio is 95%. That's a 5% pay gap.
How to read it: A pay equity gap should be reviewed by role, level, location, tenure, and performance band before taking action.
What to watch for: Adjusted vs. unadjusted gaps. Unadjusted gaps compare all employees. Adjusted gaps compare employees in the same role, level, and performance tier. Both matter.
8. Performance rating distribution
What it measures: Whether performance ratings are distributed equally across demographic groups.
Why it matters: If underrepresented employees receive lower performance ratings on average, bias might be influencing evaluations. Unequal ratings lead to unequal promotions and pay.
Formula:
Example: If 30% of men receive "exceeds expectations" ratings but only 15% of women do, performance reviews might have gender bias.
How to read it: Compare rating distributions across demographic groups and across managers. If one manager's team shows skewed distributions, that manager may need calibration training.
What to watch for: "Prove it again" bias. Underrepresented employees often have to demonstrate competence repeatedly while majority employees are assumed competent by default.
9. Inclusion survey score
What it measures: Employee perceptions of inclusion, belonging, and fairness at work.
Why it matters: Representation means nothing if employees don't feel included. Inclusion scores show whether people feel valued, heard, and able to contribute.
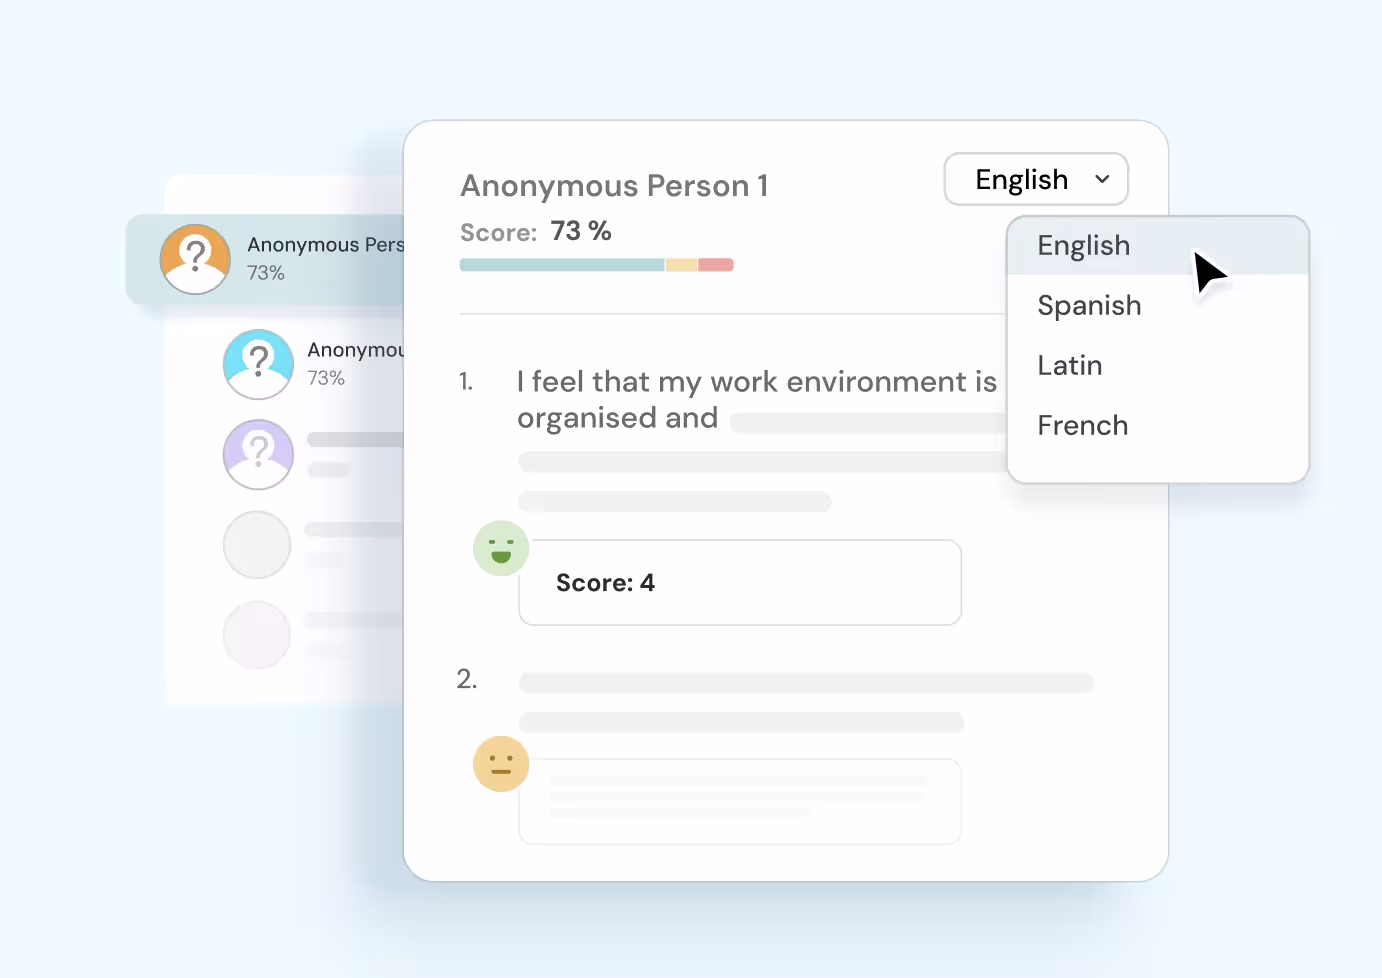
How to measure: Use anonymous employee surveys with questions like:
- "I feel valued for my unique perspectives and contributions."
- "I can be myself at work."
- "My manager listens to my ideas."
- "I have equal access to growth opportunities."
How to read it: Track scores by demographic group, department, and manager. If underrepresented employees report lower scores, investigate team culture, manager behavior, and access to opportunities.
What to watch for: Score gaps by demographic group. If underrepresented employees report lower inclusion scores than their peers, the work environment has an inclusion problem.
Many organizations use diversity and inclusion surveys to measure belonging, fairness, and psychological safety across demographic groups.
Most HR teams struggle with two things: getting employees to answer inclusion questions honestly, and segmenting responses by demographic group without spreadsheet work.
ThriveSparrow's anonymous pulse surveys let employees share honest feedback without fear, and heatmaps show you exactly where inclusion gaps exist — by team, manager, or demographic. Try it free for 14 days.
10. Belonging score
What it measures: Whether employees feel a sense of belonging at work — like they're part of the team, not just present in the building.
Why it matters: Belonging predicts retention. Employees who feel like they belong stay longer, contribute more, and engage more deeply.
How to measure: Use survey questions like:
- "I feel like I belong here."
- "I feel comfortable sharing my ideas."
- "I feel accepted by my team."
How to read it: If belonging scores are high initially but decline over time, investigate whether inclusion efforts fade after onboarding or whether career growth opportunities become unequal.
What to watch for: Belonging gaps by tenure. If belonging scores drop after the first six months, early inclusion efforts are strong but long-term culture is weak.
11. Psychological safety score
What it measures: Whether employees feel safe speaking up, sharing ideas, asking questions, and admitting mistakes without fear of punishment or embarrassment.
Why it matters: Psychological safety is the foundation of inclusion. If employees don't feel safe, they won't contribute fully — and underrepresented employees often feel the least safe.
How to measure: Use survey questions like:
- "I can share concerns without fear of retaliation."
- "It's safe to take risks on my team."
- "I can admit mistakes without being judged."
How to read it: Segment psychological safety scores by team and manager. If some teams report high safety and others don't, manager training and team norms may need attention.
What to watch for: Department gaps. If some teams have high psychological safety and others don't, manager behavior is the variable.
Organizations that already know how to measure employee engagement often have a strong foundation for measuring psychological safety at work.
12. Employee engagement by demographic group
What it measures: Engagement levels across demographic groups — whether employees feel motivated, connected, and committed to their work.
Why it matters: If underrepresented employees report lower engagement than their peers, something in the work environment is disengaging them.
How to measure: Track engagement survey scores by demographic group. Look for gaps in responses to questions like:
- "I would recommend this company as a great place to work."
- "I see a future for myself here."
- "I'm motivated to go above and beyond."
How to read it: If engagement is unequal across groups, investigate whether access to growth opportunities, manager support, or team inclusion differs by demographic.
What to watch for: Disengagement before exit. If underrepresented employees report declining engagement before leaving, retention efforts are too late.
DEI insights become much more actionable when paired with employee engagement metrics across demographic groups.
13. ERG participation rate
What it measures: The percentage of employees participating in employee resource groups (ERGs) or affinity groups.
Why it matters: ERG participation signals whether employees feel connected to community and support networks at work. Low participation might mean employees don't feel safe joining.
Formula:
Example: If 40 employees participate in ERGs and the company has 200 employees, ERG participation is 20%.
How to read it: Compare participation rates to retention and engagement data. If ERG participants have higher retention, ERGs are creating belonging. If participation is low, employees may not trust that joining is safe.
What to watch for: Participation gaps by demographic group. If ERGs exist but the target demographic isn't joining, the groups aren't meeting their needs.
14. DEI training impact
What it measures: Whether DEI training changes behavior, not just awareness.
Why it matters: Training completion rates don't measure impact. Behavior change does. If managers complete bias training but promotion equity doesn't improve, the training didn't work.
How to measure: Track behavior changes before and after training, like:
- Promotion equity by manager
- Performance rating distribution by manager
- Inclusion scores on that manager's team
How to read it: Compare pre-training and post-training metrics at the manager level. If promotion equity improves after training, the training worked. If not, the content or accountability structure needs revision.
What to watch for: Training without accountability. If training is mandatory but managers face no consequences for inequitable outcomes, the training is performative.
15. DEI initiative effectiveness
What it measures: Whether DEI initiatives improve outcomes — not just activity, but results.
Why it matters: Organizations often track DEI activity (training sessions held, ERG meetings run, hiring events attended) instead of outcomes (promotion equity improved, retention gaps closed, inclusion scores increased). Activity doesn't equal impact.
How to measure: Before launching a DEI initiative, define success metrics. After implementation, compare outcomes to baseline. Did hiring diversity increase? Did retention gaps shrink? Did inclusion scores improve?
How to read it: If an initiative shows no measurable improvement in the targeted metric after six months, either the initiative needs adjustment or the metric needs to be reconsidered.
What to watch for: Initiatives that measure activity instead of outcomes. "We held 12 DEI training sessions" is not a success metric. "Promotion equity improved after changing promotion criteria" is.
How to measure DEI success step by step
Tracking DEI metrics isn't complicated, but it does require intentional data collection, analysis, and action planning. Here's how to do it.
Step 1: Define DEI goals
Start with the problem you're trying to solve. Are you trying to:
- Increase leadership diversity?
- Close pay gaps?
- Improve retention for underrepresented employees?
- Boost inclusion scores?
Goals shape which metrics matter. Don't track everything — track what matters to your specific DEI priorities.
Step 2: Choose KPIs
Once you know your goals, pick 5–10 KPIs to track. Focus on metrics that measure outcomes, not just activity.
For example:
- Goal: Improve leadership diversity
- KPIs: Leadership representation, promotion rate by demographic, internal mobility by demographic
Step 3: Collect employee data safely
DEI analytics require demographic data. Collect it through:
- HRIS systems
- Anonymous employee surveys
- Voluntary self-identification forms
Make sure data collection is:
- Voluntary: Employees shouldn't be forced to disclose demographic information.
- Anonymous: Aggregate data by group, not by individual.
- Secure: Store demographic data separately from performance data to prevent bias.
Before collecting demographic data, explain why the data is being collected, who can access it, how it will be reported, and what action will be taken from it.
Employees are more likely to self-identify when they trust that the data will not be used against them. Use minimum reporting thresholds so small groups are not exposed in reports.
Step 4: Compare outcomes across groups
DEI metrics only matter when you compare them. Don't just track "promotion rate" — track promotion rate by demographic group. Comparison reveals inequity.
For example:
- 40% of men promoted vs. 25% of women promoted = promotion equity problem
- 15% turnover for majority employees vs. 30% turnover for underrepresented employees = retention equity problem
Step 5: Build DEI dashboards
DEI dashboards centralize metrics so leaders can track progress over time. A strong DEI dashboard includes:
- Workforce representation by level and department
- Hiring pipeline diversity by stage
- Promotion equity by demographic group
- Retention by demographic group
- Inclusion and belonging scores
- Pay equity ratios
Tools like ThriveSparrow can help HR teams collect anonymous inclusion feedback, segment results by demographic group, track sentiment trends, and turn survey insights into action plans.
Modern DEI dashboards increasingly combine quantitative metrics with employee sentiment analysis.
Step 6: Turn insights into action plans
Tracking metrics without action is reporting, not improvement. When metrics reveal gaps, create action plans to close them.
For example:
- Gap: Women promoted at half the rate of men
- Action plan: Audit promotion criteria, train managers on bias, set promotion equity targets
Metrics show the problem. Action plans fix it.
Which DEI metrics matter most for different company goals?
Not all DEI metrics matter equally for every organization. Here's which metrics to prioritize based on your company goals.
If you're trying to solve everything at once, you'll solve nothing. Pick one or two goals, focus on the metrics that matter for those goals, and build action plans around them.
DEI dashboard example: what to include
A DEI dashboard should give leadership a complete view of diversity, equity, and inclusion across the employee lifecycle. Here's what to include.
Section 1: Workforce representation
- Total employee count by demographic group
- Representation by department
- Representation by level (entry, mid, senior, leadership)
Section 2: Hiring
- Candidate pipeline diversity by stage
- Selection rate by demographic group
- Time to hire by demographic group
Section 3: Promotion
- Promotion rate by demographic group
- Internal mobility by demographic group
- Time to promotion by demographic group
Section 4: Retention
- Retention rate by demographic group
- Voluntary turnover by demographic group
- Exit reasons by demographic group
Section 5: Inclusion
- Inclusion survey score by demographic group
- Belonging score by demographic group
- Psychological safety score by demographic group
Section 6: Engagement
- Employee engagement score by demographic group
- Manager effectiveness by demographic group
- ERG participation rate
Section 7: Pay equity
- Pay equity ratio by role and level
- Adjusted pay gap analysis
- Compensation distribution by demographic group
Each section should show:
- Current data
- Trend over time (quarter over quarter, year over year)
- Comparison to benchmarks (if available)
How to use a DEI dashboard
A DEI dashboard should not be reviewed once a year and forgotten. HR teams should use it quarterly to spot trends, compare groups, and identify where action is needed.
For example, if hiring diversity improves but leadership diversity stays flat, the issue may be internal mobility or promotion access. If inclusion scores are low in one department, the next step is not another company-wide DEI program. It is a team-level action plan.
Real examples of DEI metrics in action
Here's how DEI metrics reveal problems that would otherwise stay hidden.
Example 1: Retail promotion bias
A retail company tracked promotion rates by gender and discovered that women in store management roles were promoted to regional management at half the rate of men — despite similar performance ratings.
The data revealed the problem. The action plan fixed it:
- Audited promotion criteria to remove subjective language
- Required promotion committees to include diverse perspectives
- Set promotion equity targets for regional leadership
Over time, the company could track whether promotion equity improved after changing promotion criteria.
Example 2: Healthcare turnover disparities
A healthcare organization tracked retention by demographic group and found that Black nurses left within the first year at twice the rate of white nurses.
Exit interviews revealed the problem: Black nurses reported feeling excluded from team social events, passed over for leadership opportunities, and subjected to microaggressions from patients without management support.
The action plan:
- Launched belonging-focused onboarding for all new nurses
- Trained managers on inclusive leadership and microaggression response
- Created mentorship programs for underrepresented nurses
The organization could then monitor whether retention disparities decreased over time.
Example 3: Remote employee belonging gaps
A tech company tracked belonging scores by work location and found that remote employees reported significantly lower belonging scores than in-office employees — and the gap was even larger for underrepresented remote employees.
The action plan:
- Created virtual social events and team-building rituals
- Trained managers on inclusive remote leadership
- Built intentional communication practices to include remote voices in meetings
The company could compare belonging scores before and after implementing inclusive remote work practices.
These examples show what DEI metrics do: they reveal problems, create accountability, and guide action.
DEI metrics that companies often track incorrectly
Some DEI metrics look useful but don't actually measure what matters. Here's what to avoid.
1. Vanity metrics
Vanity metrics measure activity, not outcomes.
Examples:
- "We held 15 DEI training sessions this year."
- "We attended 10 diversity recruiting events."
- "We launched 3 ERGs."
None of these metrics show whether DEI improved. They show effort, not impact.
Better metrics:
- Did promotion equity improve after DEI training?
- Did hiring diversity increase after recruiting events?
- Did ERG participation correlate with higher retention?
2. Representation-only tracking
Many companies track workforce representation but ignore whether underrepresented employees feel included, supported, or promoted fairly.
Representation without inclusion is performative. If diverse employees don't feel like they belong, they'll leave.
Track representation and inclusion together.
3. Ignoring inclusion
Quantitative metrics (representation, pay equity, promotion rates) are important, but they don't show whether employees feel safe, valued, or heard.
Inclusion metrics like belonging scores and psychological safety reveal the employee experience behind the numbers.
4. No action planning
Tracking metrics without action turns DEI into a reporting exercise. If promotion equity is unequal and nothing changes, the metric didn't matter.
Metrics should trigger action plans, not just dashboards.
5. Too many KPIs
Some organizations track 50+ DEI metrics. That's too many. Leaders can't focus on everything.
Pick 5–10 KPIs that align with your DEI goals. Track those consistently. Ignore the rest.
6. Lack of segmentation
Tracking "overall diversity" hides the real story. Representation might look strong company-wide but terrible in leadership. Retention might look strong overall but weak for underrepresented employees.
Segment data by:
- Department
- Level
- Tenure
- Demographic group
Segmentation reveals where problems actually exist.
Common mistakes to avoid when tracking DEI metrics
Here's what goes wrong when organizations measure DEI poorly.
1. Lack of anonymity
If employees don't trust that their demographic data is anonymous, they won't self-identify accurately. Bad data leads to bad decisions.
Always:
- Aggregate data by group, not by individual
- Store demographic data separately from performance data
- Communicate how data is used and protected
2. Poor data collection
If demographic data is outdated, incomplete, or inaccurate, DEI metrics are useless.
Make sure:
- Employees can update their demographic information voluntarily
- Self-identification forms include inclusive options (non-binary gender options, multiracial options, etc.)
- Data collection is ongoing, not one-time
3. Measuring without action
If metrics reveal pay gaps, promotion inequity, or retention disparities but nothing changes, employees lose trust. Metrics without action plans are performative.
4. Department averages only
Company-wide averages hide department-level problems. Diversity might look strong overall but terrible in engineering. Retention might look strong overall but weak in sales. Always segment data by department, level, and demographic group.
5. Missing employee sentiment
Quantitative metrics show outcomes. Qualitative metrics show why. If retention is low for underrepresented employees, exit interviews and inclusion surveys reveal the reasons. Track both numbers and sentiment.
Final thoughts on DEI metrics
DEI metrics are not just numbers for an annual report. They show where employees are hired, where they grow, where they feel included, and where they leave.
The strongest DEI measurement systems combine workforce data with employee feedback, belonging insights, sentiment analysis, and action planning.
Organizations that measure only representation often miss the bigger picture. Real DEI progress comes from understanding whether employees feel safe, valued, supported, and given equal opportunities to succeed.
If you're measuring DEI seriously, you need a feedback system that employees trust. Anonymous surveys with demographic segmentation and sentiment analysis turn inclusion measurement from a reporting exercise into continuous improvement.
Try ThriveSparrow free for 14 days.
FAQs about DEI metrics
1. What are DEI metrics?
DEI metrics are measurable indicators that help organizations track diversity, equity, inclusion, and belonging across hiring, promotion, retention, pay, leadership, and employee experience.
2. What are the most important DEI metrics to track?
The most important DEI metrics include workforce representation, promotion equity, retention by demographic group, pay equity, inclusion score, and belonging score. Organizations should measure DEI across hiring, growth, compensation, engagement, and retention — not just representation.
3. How do you measure inclusion?
Measure inclusion through anonymous employee surveys that ask whether employees feel valued, heard, safe, and able to contribute fully. Track inclusion scores by demographic group to identify gaps.
4. How do you measure DEI success?
Measure DEI success by tracking outcomes, not activity. Successful DEI initiatives improve representation, close promotion gaps, reduce retention disparities, increase inclusion scores, and achieve pay equity.
5. What is the difference between diversity metrics and inclusion metrics?
Diversity metrics measure representation (who's in the building). Inclusion metrics measure employee experience (whether people feel valued and safe). Both matter.
6. What is a DEI scorecard?
A DEI scorecard is a dashboard that tracks DEI metrics across the employee lifecycle — hiring, promotion, retention, engagement, and inclusion. It centralizes data so leaders can monitor progress and identify gaps.
7. What are the best DEI metrics for leadership teams?
The best DEI metrics for leadership teams include leadership representation, promotion equity, retention by demographic group, pay equity, inclusion score, and engagement by demographic group. These metrics show whether DEI progress is happening across hiring, growth, compensation, and employee experience.

