










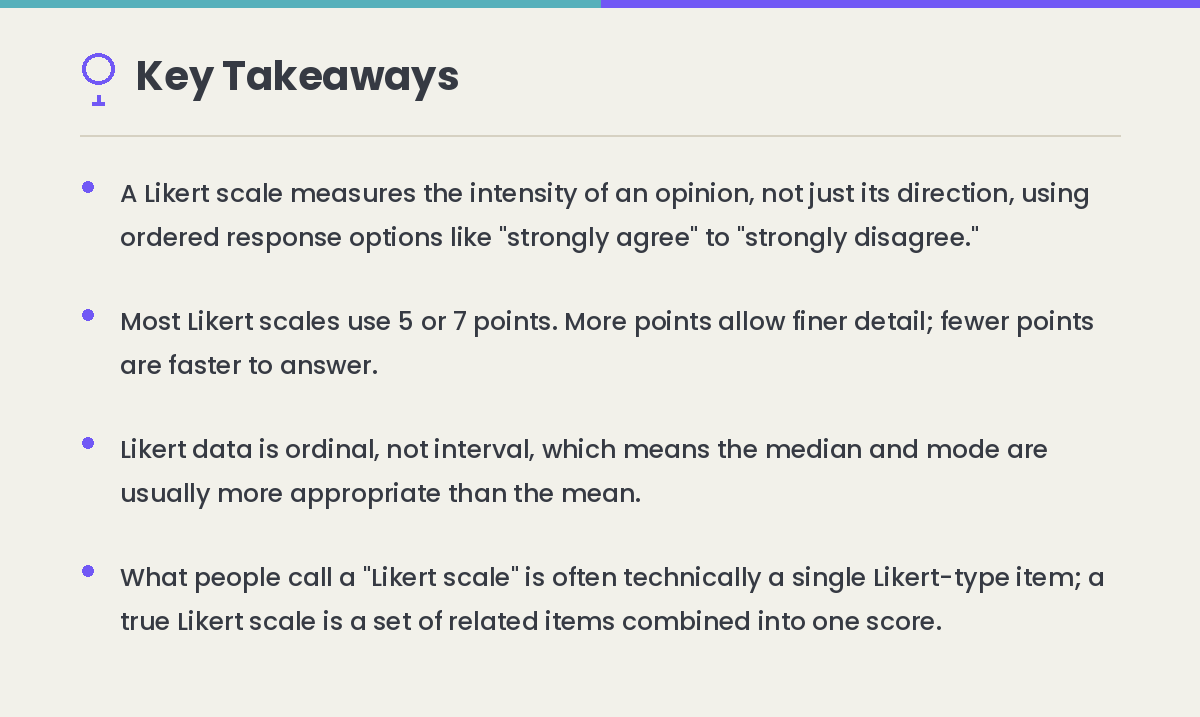
A Likert scale is a survey question format that measures opinions, attitudes, or behaviors using a range of ordered response options, from one extreme to another, such as "strongly disagree" to "strongly agree." Instead of forcing a simple yes-or-no answer, it lets people say how strongly they feel.
Named after the psychologist Rensis Likert, who introduced the format in a 1932 paper, the scale turns subjective feelings into numbers you can compare, track, and analyze. It's one of the most widely used tools in survey research, from academic psychology to everyday employee and customer feedback.
This guide covers what a Likert scale actually is, the different types and point counts, real examples you can adapt, how to write good questions, and how to analyze the data once you have it.
What Is a Likert Scale?
.avif)
A Likert scale is a rating scale that measures attitudes, opinions, or behaviors along a spectrum rather than a simple binary choice. Respondents read a statement or question and pick the response option that best matches how they feel, from one extreme to the opposite one.
Here's a distinction most guides skip: what people commonly call a "Likert scale" is often technically a Likert-type item, a single rated question. A true Likert scale is a composite instrument: several related items summed into one overall score to measure a broader construct, like job satisfaction or brand trust. In everyday use, both terms get used interchangeably, and that's fine for most purposes. But if you're designing a formal research instrument, the distinction matters for how you calculate and report your results.
How a Likert Scale Works
Setting the terminology aside, here's what actually happens when someone fills one out. Each Likert-type item presents a statement, followed by a set of ordered response options. Every option is assigned a number, so "Strongly agree" might be a 5 and "Strongly disagree" a 1. That numeric coding is what turns a subjective feeling into data you can compare across respondents, track over time, or run statistical tests on.
A standard 5-point agreement item looks like this:
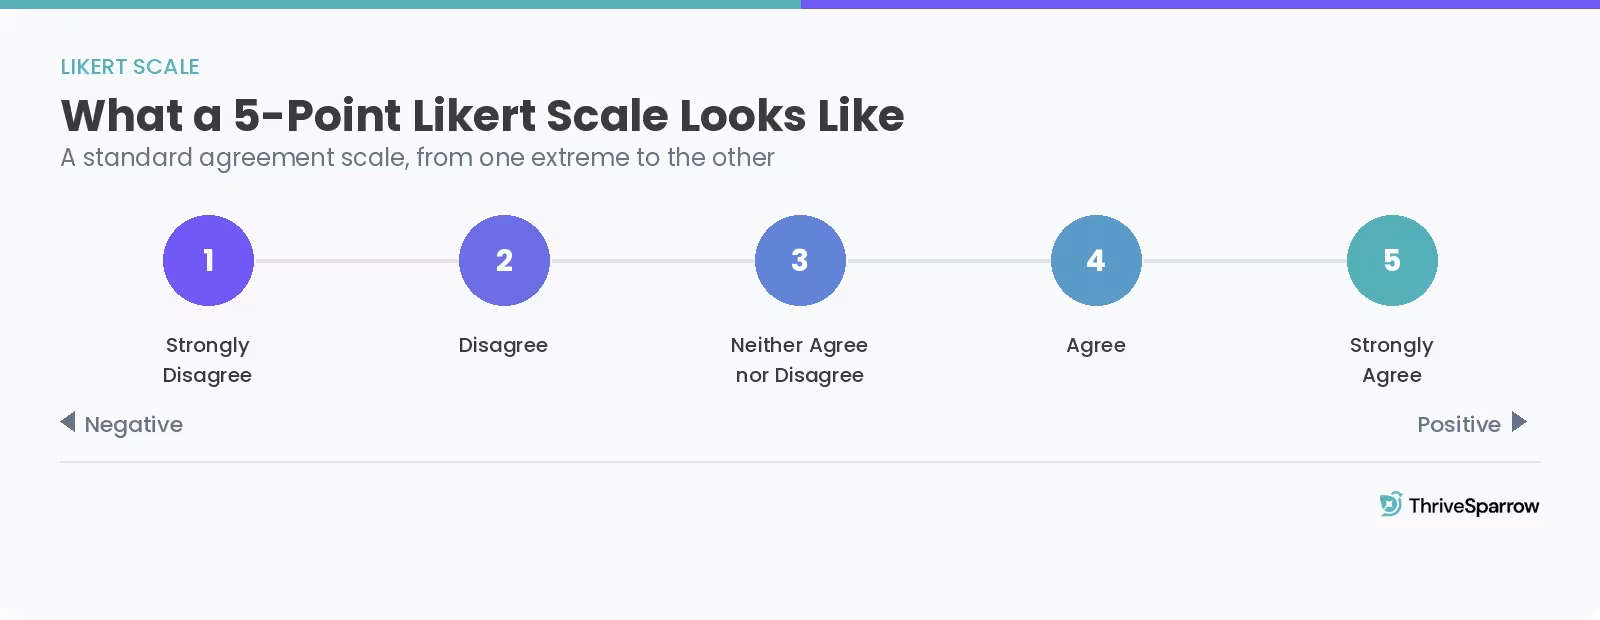
- Strongly disagree
- Disagree
- Neither agree nor disagree
- Agree
- Strongly agree
The scale assumes attitudes exist on a continuum, not just as a "yes" or "no." Someone who mildly agrees with a statement and someone who strongly agrees with it get different scores, which is exactly the nuance a plain yes/no question would lose.
Types of Likert Scales
That basic mechanism can be built in a few different ways, depending on what you're actually trying to measure. Likert scales fall into two structural categories.
1. Unipolar scales measure the intensity of a single attribute, ranging from none of it to the maximum amount. A satisfaction scale running from "Not at all satisfied" to "Extremely satisfied" is unipolar: there's no true opposite state, just more or less of the same thing.
2. Bipolar scales measure two opposing states with a meaningful midpoint between them. An agreement scale from "Strongly disagree" to "Strongly agree" is bipolar: disagreement and agreement are genuine opposites, and "neither agree nor disagree" is a real, meaningful middle ground.
Beyond that structural split, Likert scales are commonly built around five response vocabularies, each suited to a different kind of question:
- Agreement: Strongly disagree → Strongly agree
- Satisfaction: Not at all satisfied → Extremely satisfied
- Importance: Not at all important → Extremely important
- Likelihood: Not at all likely → Extremely likely
- Frequency: Never → Always
Matching the vocabulary to what you're actually asking matters more than it might seem. Someone who "strongly agrees" that they use an app daily hasn't told you how often they open it. If frequency is what you want to know, use a frequency scale, not an agreement one.
How Many Points Should a Likert Scale Have?
Once you've picked a type and a vocabulary, the next decision is how many response options to actually offer. Most Likert scales use 5 or 7 response points, and that range consistently balances enough detail against how much effort you're asking of respondents. Four-point and six-point scales exist too, along with less common 9-point and 10-point versions for cases that need finer granularity.
The choice that matters most isn't really the number itself. It's whether you include a midpoint.
Odd-numbered scales (5, 7, 9 points) include a neutral middle option, letting genuinely undecided respondents say so honestly instead of being pushed toward a side they don't hold.
Even-numbered scales (4, 6 points) remove that neutral option entirely, forcing a directional choice. This is sometimes called a forced-choice scale, and it's useful when a genuine "no opinion" is rare in your audience, or when you specifically need a lean one way or the other.
A rough rule of thumb: use 5 points for quick, everyday feedback, especially on mobile, where longer scales are harder to scan and tap through accurately. Reach for 7 points when you're doing more formal research and need to detect smaller shifts in opinion. Beyond 7, most respondents struggle to meaningfully distinguish between adjacent options, and the added precision rarely earns back the extra effort.
Likert Scale Examples
Here are real, ready-to-adapt examples across the five most common response types.
1. Agreement examples
How much do you agree or disagree that the company helps its employees grow their careers? Strongly disagree · Disagree · Neither agree nor disagree · Agree · Strongly agree
The checkout process was straightforward.Strongly disagree · Disagree · Neither agree nor disagree · Agree · Strongly agree
2. Satisfaction examples
How satisfied are you with our service speed? Not at all satisfied · Slightly satisfied · Moderately satisfied · Very satisfied · Extremely satisfied
How satisfied are you with the range of products available? Not at all satisfied · Somewhat satisfied · Satisfied · Very satisfied · Extremely satisfied
3. Importance examples
How important is service speed to you? Not at all important · Slightly important · Somewhat important · Very important · Extremely important
How important is it that your manager checks in with you regularly? Not at all important · Slightly important · Moderately important · Very important · Extremely important
4. Likelihood examples
How likely are you to recommend this product to a friend or colleague? Not at all likely · Slightly likely · Moderately likely · Very likely · Extremely likely
How likely are you to attend a future event like this one? Not at all likely · Slightly likely · Moderately likely · Very likely · Extremely likely
5. Frequency examples
How often do you use this feature? Never · Rarely · Sometimes · Often · Always
How often do you receive feedback from your manager? Never · Rarely · Sometimes · Often · Always
If you're building out a full survey rather than a single question, our guide to employee survey questions covers how to combine question types like these into a complete instrument, and our employee engagement survey questions guide applies the same principles specifically to engagement research.
How to Write Good Likert Scale Questions
Getting a Likert scale right is less about the response options and more about the question itself. A poorly worded item produces bad data no matter how well-designed the scale underneath it is.
1. Ask questions, not statements. A statement like "The service was excellent" invites acquiescence bias, the tendency for people to simply agree rather than genuinely evaluate. Phrasing it as "How would you rate the service?" asks for a real judgment instead of a reflexive nod.
2. Ask about one thing at a time. A double-barreled item like "The price was fair and the quality was high" can't be answered accurately by someone who agrees with one half and not the other. Split it into two separate questions.
3. Match the response labels to the construct. Don't default to agreement labels for every question. If you're asking about frequency, use a frequency scale. If you're asking about satisfaction, use a satisfaction scale. Forcing an agreement scale onto a question that's really about frequency or likelihood produces vaguer answers than the more specific vocabulary would.
4. Keep polarity consistent. If your scale runs from negative to positive, keep every item in the survey running the same direction. Flipping the order partway through is a common source of respondent confusion and data entry errors.
5. Use fully labeled response options. Vague labels like "Good" and "Great" mean different things to different people. Concrete, evenly spaced labels like "Slightly satisfied," "Moderately satisfied," and "Very satisfied" reduce that ambiguity and produce more reliable data.
6. Include reverse-worded items where appropriate. In longer, multi-item scales, mixing in a few negatively worded items (alongside positively worded ones) helps catch respondents who are just agreeing with everything without reading closely. These items get reverse-scored during analysis so a high score still means the same thing throughout.
How to Analyze Likert Scale Data
A well-written question still needs to be analyzed correctly, and this is where a lot of otherwise good surveys go wrong. Likert scale responses have a rank order, but the distance between any two points on the scale can't be assumed to be equal. The gap between "agree" and "strongly agree" isn't necessarily the same size as the gap between "disagree" and "strongly agree." That's why most methodologists treat individual Likert-type items as ordinal data, not interval data.
This matters because it changes which statistics are actually appropriate:
- Use the median or mode, not the mean, to summarize a single item. The mean assumes equal spacing between points, an assumption ordinal data doesn't support.
- Visualize responses with a bar chart, not a histogram, since the categories are discrete, not continuous.
- For a composite scale (several related items summed into one score), many researchers treat the total as interval-level data and report a mean and standard deviation, provided they state that assumption explicitly.
A practical shortcut used widely in industry, if not always in academic research, is collapsing categories into simplified groups:
- Top 2 Box: the two most positive responses combined (e.g., "Agree" + "Strongly agree")
- Bottom 2 Box: the two most negative responses combined
- Neutral: the midpoint, reported on its own
This turns a five- or seven-category breakdown into a clean positive/neutral/negative summary that's far easier to report to a non-technical audience, without losing the underlying detail if you need to drill back in later.
Likert Scale vs. Other Rating Scales
All of this assumes you're actually using a Likert scale in the first place, and it's worth checking that assumption. "Likert scale" gets used loosely to describe almost any numbered survey question, but it's actually one specific format among several related ones.
A rating scale is the broader category: any numbered scale asking someone to evaluate something. A Likert scale is a specific type of rating scale, one that always measures degree of agreement or attitude using fully labeled, ordered options. A plain 1–10 satisfaction score, with no labels on the middle points, is a rating scale but not technically a Likert scale.
A semantic differential scale also measures attitudes, but places respondents between two opposite adjectives on an unlabeled continuum, like "Boring ←→ Exciting" on a 7-point line, rather than using agreement statements with labeled steps. Use a Likert scale when you want to measure agreement, frequency, importance, or satisfaction with a specific statement. Use a semantic differential scale when you want to capture how something feels along a dimension, like whether a brand seems modern or traditional.
Net Promoter Score (NPS) uses an 11-point scale (0–10) asking how likely someone is to recommend something. It's technically a Likert-type likelihood item, but it's analyzed differently: respondents are grouped into Promoters (9–10), Passives (7–8), and Detractors (0–6), with the score calculated as the percentage of Promoters minus the percentage of Detractors. NPS gives you a single benchmark number; the follow-up questions around it give you the diagnostic detail behind why that number looks the way it does.
If your survey already includes performance or quality ratings, see our guide to performance rating scale examples for how these formats show up specifically in workplace evaluations.
Advantages and Limitations of Likert Scales
Like any research tool, a Likert scale is a trade-off. It's worth being honest about both sides before you build your next survey around one.
Advantages:
- Easy to answer and analyze. Closed-ended options mean respondents don't need to generate their own wording, and the numeric coding supports straightforward statistical analysis.
- More nuance than yes/no. Capturing degree of feeling, not just direction, surfaces differences a binary question would flatten out entirely.
- Familiar to respondents. Most people have completed a Likert-style question before, which means no learning curve and generally higher completion rates.
- Scales to large samples. The structured format makes it practical to collect and compare responses from hundreds or thousands of people at once.
Limitations:
- Ordinal, not interval, data. As covered above, this restricts which statistical tests are technically appropriate, and it's a common source of analysis mistakes when ignored.
- No explanation of the "why." A score tells you someone was dissatisfied; it doesn't tell you why. Pairing a Likert item with an open-ended follow-up question closes that gap.
- Prone to response bias. Acquiescence bias, social desirability bias, and a general reluctance to pick extreme options can all skew results, particularly on sensitive topics.
- Central tendency bias. Some respondents default to the midpoint regardless of their actual opinion, especially in longer surveys where fatigue sets in.
Turning Likert Data Into Something You Actually Act On
A well-designed Likert scale question is only half the job. The other half is doing something with what it tells you, whether that's a customer satisfaction score, an employee sentiment reading, or feedback on a new feature.
If you're building this into a recurring employee feedback process rather than a one-off survey, ThriveSparrow's pulse surveys come with pre-built Likert-scale question templates, so you're not writing every item from scratch. If you want a lower-commitment starting point first, our library of free employee survey templates is a genuinely useful reference whether or not you ever use ThriveSparrow itself.
.svg)
FAQs
1. What is a Likert scale in simple terms?
It's a survey question that offers a range of ordered answers, such as "strongly disagree" to "strongly agree," instead of a plain yes or no. Respondents pick the option that best matches their opinion, with graded choices in between.
2. What is a 5-point Likert scale?
It's a version with five response options: two opposing extremes, a neutral midpoint, and two intermediate options between them. For example: Strongly disagree, Disagree, Neither agree nor disagree, Agree, Strongly agree.
3. Is a 5-point or 7-point Likert scale better?
Neither is universally better. A 5-point scale is faster to complete and works well for everyday feedback, especially on mobile devices. A 7-point scale offers finer detail and is often preferred in academic or clinical research, where detecting small shifts in opinion matters more than speed.
4. Are Likert scales ordinal or interval data?
Individual Likert-type items are generally treated as ordinal data, since responses have a clear order but the gaps between them aren't guaranteed to be equal. Composite scores from multiple combined items are sometimes treated as interval data, provided that assumption is stated explicitly in the analysis.
5. What's the difference between a Likert scale and a Likert-type item?
A Likert-type item is a single rated question. A true Likert scale is a set of related Likert-type items summed together into one overall score measuring a broader construct, like job satisfaction. In everyday conversation, people use both terms interchangeably.
6. Should I use an odd or even number of points?
Use an odd number (5 or 7) when a genuine neutral opinion is a realistic and meaningful response for your audience. Use an even number (4 or 6) when you want to force a directional answer and suspect true neutrality would be rare or would let people avoid taking a position.